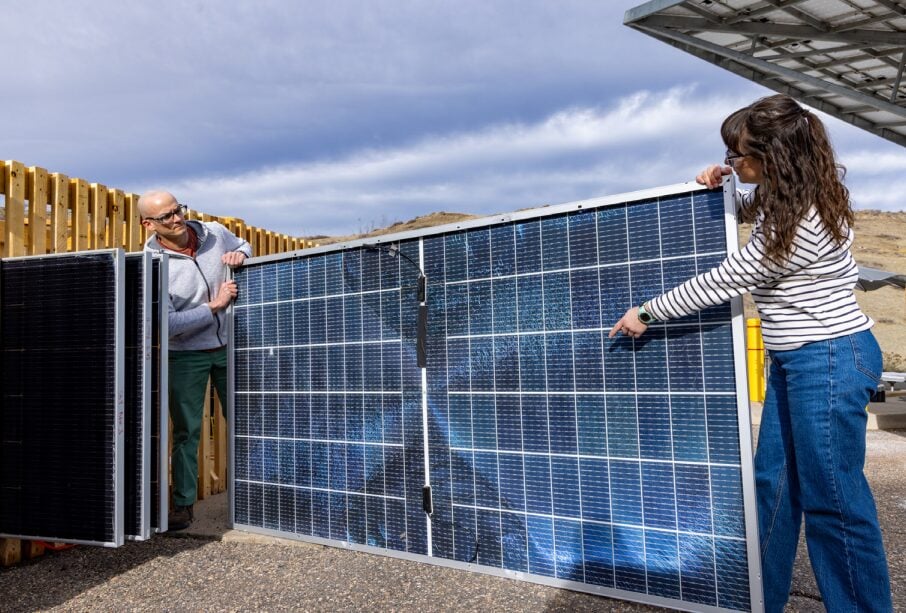
Dual-glass PV modules are experiencing low-energy glass fracture under expected conditions of use at an alarming rate. David Devir of VDE Americas looks at the origins of today’s supersized PV module glass problem and considers how the industry can engineer a return to reliability.
The solar industry’s sustained ability to reduce fielded PV plant costs is a collective success story with global implications. In 2024, solar markets around the world added approximately 600GW of new PV power generation, resulting in a cumulative global capacity of over 2.2TW. For the third year running, solar was the world’s largest source of new power generation capacity.
Try Premium for just $1
- Full premium access for the first month at only $1
- Converts to an annual rate after 30 days unless cancelled
- Cancel anytime during the trial period
Premium Benefits
- Expert industry analysis and interviews
- Digital access to PV Tech Power journal
- Exclusive event discounts
Or get the full Premium subscription right away
Or continue reading this article for free
Unfortunately, market growth and component cost curves do not tell the whole story. On one hand, exponential growth in solar development and deployment is foundational to electrification and decarbonisation strategies intended to ensure a worthwhile future. On the other, the technical due diligence community continues to find evidence of cracks in the industry’s foundation.
PV module glass breakage has long been an observed failure mode in fielded solar projects. In recent years, however, the nature and causes of solar glass fracture have changed in alarming and unsustainable ways. Given the scale of the global market, increasing solar glass failure rates have the potential to become a major reliability issue for manufacturers, developers, owners, insurers and investors.
To help stakeholders mitigate the threat of premature field failures, this article looks at the market, technology, and testing trends that appear to contribute to a rise in reports of solar glass breakage. It also explores ways in which a holistic industry response might contain this multi-faceted issue and prevent a crisis of confidence. But first, I will briefly review recent symptoms and evidence of a failure mode that is largely specific to dual-glass bifacial PV modules.
Rise of low-energy glass fracture
Glass fracture in real-world solar installations is not a new phenomenon—and, in and of itself, it is not necessarily cause for undue concern. Unlike a highly ductile material like aluminium, glass cannot withstand significant plastic deformation prior to mechanical failure. When glass deforms beyond its ability to return to its original shape, it fractures, either at the location of an applied external stress or a strength-limiting internal defect.
As operations and maintenance technicians and forensic investigators know all too well, PV modules have always been susceptible to brittle fracture. For several decades, the root causes of solar glass breakage in the field were generally readily apparent based on an analysis of fracture patterns and failure distributions.
A pattern of breakage originating at module clamps might reveal construction-related errors during installation, whereas back-side module damage might point to debris-contact damage during mowing. Failure distribution maps might identify terrain-related issues such as sinking piles, whereas temporal correlations mapped to severe weather events might point to wind, snow, or hail as a root cause.
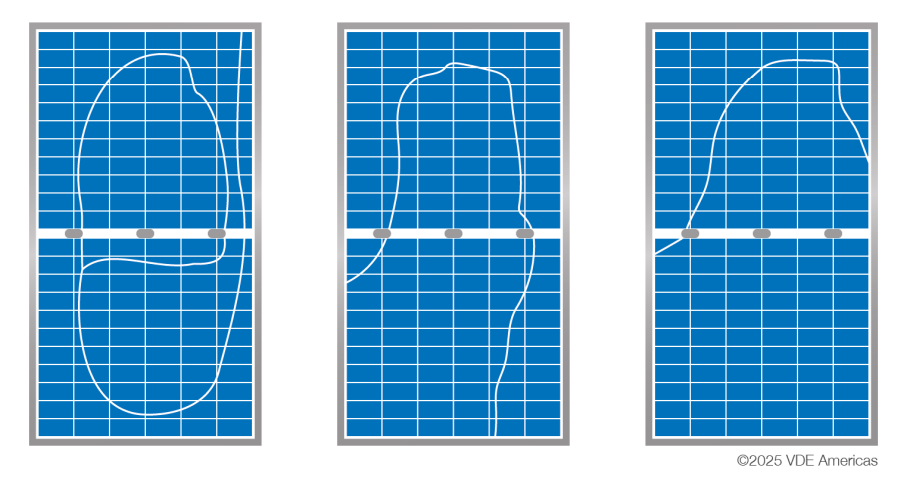
A notable change in solar glass breakage in recent years is the emergence of low-energy fracture patterns, as shown in Figure 1. Prior to the early 2020s, PV module glass failure was typically catastrophic in nature, resulting in a highly branched crack pattern. A classic high-energy glass breakage pattern is characterised by radial and concentric fractures that provide clear evidence of the fracture origin. Unlike shattered glass resulting from a high-energy impact, low-energy glass fracture patterns often have few or no secondary branches. As a result, visual inspection in the field may not identify the specific external force that has triggered a low-energy fracture.
While the root cause of a low-energy fracture may not be readily apparent to an untrained eye, these are not truly spontaneous events. My first experience with glass failure was with Osram-Sylvania, an automative lamp manufacturer, analysing the root cause of low-energy fractures in glass with some assistance and guidance from Corning. In every case, our investigations would identify some sort of glass defect related to manufacturing—typically, a void, inclusion or edge flaw—at the fracture origin.
Fracture rates in fielded systems
Anecdotal reports from all corners of the globe and a growing body of published scientific data provide evidence of a potentially systemic problem characterised by seemingly unexplainable glass breakage.
“In the past few years, our team has found power plants around the world where PV module glass has broken with no obvious cause,” write the authors of a November 2024 technical report published by the National Renewable Energy Laboratory (NREL). [1] “Instead of hundreds of cracks dividing the glass into tiny fragments, a few large cracks can form. The cracks often don’t show a clear origin, and there is often no link to severe weather or an impact event.”
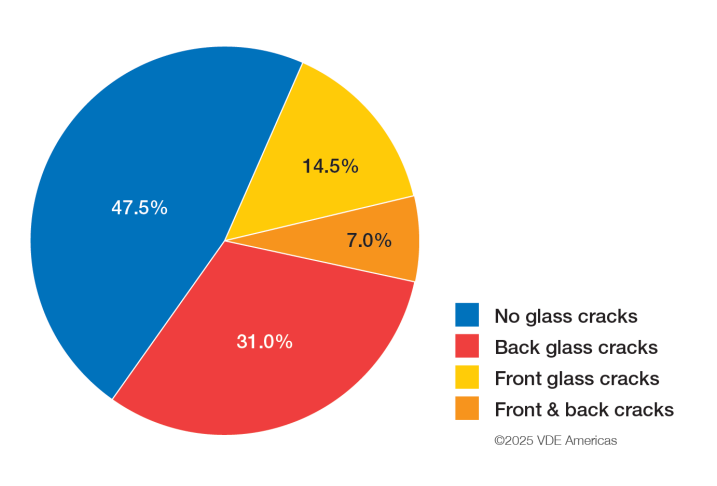
At least one research institution has been able to document low-energy glass fracture in in the field over a period of time [2]. Specifically, the Strategic Research Group on Solar Energy at the Federal University of Santa Clara (Fotovoltaica UFSC) maintains a highly instrumented bifacial PV module testbed in the south of Brazil. At the ~100kW-rated pilot project, 158 large-area (~3m2) doubleglass PV modules are deployed across five single-axis tracker systems and one fixed-tilt system.
Since commissioning the project in July 2022, Fotovoltaica UFSC researchers have documented glass fracture frequency, distribution and patterns across the site in parallel with meteorological data. According to a poster presented in March 2023, low-energy glass fracture occurred at an average rate of roughly 14 modules per month. Over an eight-month period, researchers observed glass cracks on 83 out of 158 modules (52.5%), as detailed in Figure 2.
While the glass fracture rate at Fotovoltaica UFSC is likely an outlier within the total population of large area bifacial PV modules fielded since 2022, a DNV white paper published in 2024 documented a rear glass breakage rate of over 15% at a tracker-mounted bifacial project in the Asia-Pacific region. In this case, forensic investigators found a correlation between mid-level wind speed and glass fracture in moderately sized bifacial modules (~2m2) [3].
Though project- or product-specific details are often obscured by owners and manufacturers, it is not uncommon to hear about real-world sites with 2%, 5% and even 10% glass fracture rates at PV reliability workshops or operations and maintenance conferences.
As a thought experiment, imagine a 100MW-rated utility-scale solar farm deployed using 600W bifacial PV modules. A 2% glass fracture rate on a project of this scale would eventually require the removal of 3,333 modules and the procurement of five 40-foot container loads of replacement modules. This would likely be considered a devastating hit to a project’s operating expenditures and pro forma cash flow.
Winning the race on price
Reviewing the due diligence community’s technical reports related to spontaneous glass breakage in modern double-glass module, one is reminded of the admonition, “Be careful what you wish for.” In 2011, the US Department of Energy launched a SunShot Initiative with an end-of-decade goal of reducing the total cost of solar energy by 75%. The US utility solar sector achieved this goal in 2017, well ahead of the 2020 target [4].
Global markets followed a similar trend. According to an annual report published by the International Renewable Energy Agency (IRENA), the levelised cost of electricity (LCOE) for utility-scale solar power plants dropped by 82% over a 10-year period running from 2010 to 2019 [5]. While electricity prices writ large have generally increased due to inflationary pressures over the past five years, utilityscale solar currently offers the lowest LCOE of any power generation source [6].
To win the race to the bottom on energy pricing, the solar industry has had to leverage economies of scale and cost-cutting opportunities wherever and whenever possible—all the while raising the bar on power, efficiency and specific yield (kWh/kW). The good news is that the industry has largely met or exceeded expectations on all counts. The bad news is that achieving these cost savings has resulted in some PV power plants racked with panes stressed to the breaking point.
Supersized glass, lighter structures
Since 2015, the power output, gross area and weight for typical crystalline silicon (c-Si) PV modules intended for utility-scale applications have increased by roughly 114%, 65%, and 99%, respectively. In parallel, aluminium frame height, front glass thickness, and mechanical load profile have decreased by more than 14%, 37% and 55%, respectively. In other words, as utility-scale PV modules have increased in size and weight, they have grown weaker. These electrical, physical, and structural trends are evident in the table below.
| 2015 | 2020 | 2025 | Change | |
| Average power (W) | 280 | 375 | ≥600 | 114% |
| Module area (m2) | 1.7 | 2.1 | 2.8 | 65% |
| Module weight (kg) | 19.0 | 21.1 | 37.8 | 99% |
| Frame height (mm) | 35 | 35 | 30 | -14.3% |
| Frame width (mm) | 40 | 35 | 35 | -12.5% |
| Front glass thickness (mm) | 3.2 | 3.2 | 2 | -37.5% |
| Mechanical load (Pa) | 3,600 | 2,400 | 1,600 | -55.6% |
The net result of the trend toward supersized PV modules (~3m2) is generally positive, as larger high efficiency PV modules increase energy yield while reducing levelised cost. The reduction in total module count provides material and labour savings by driving down the number of support structures and mechanical and electrical connections, and reducing the amount of cabling, all of which allow for reductions in assembly time. Though these technology trends allow for meaningful downstream cost savings, they are not necessarily conducive to system durability and resiliency.
Engineering, procurement and construction (EPC) firms are integrating larger and weaker modules on single-axis tracker tables that are often longer or larger in area than ever before. To minimise upfront capital expenditures, engineers have gone to great lengths to remove any unnecessary structural material from these support structures. In parallel, leading tracker manufacturers have developed hail defence strategies that stow modules at the highest possible tilt angle—in some cases as high as 75° or 77°—and increase wind loading.
As compared to earlier PV power plant designs, supersized PV modules and tracker tables expose structural systems to higher loads and more stress. At the same time, changes to perimeter frame profiles and dimensions mean that a shorter and narrower beam now supports a larger sail area. Moreover, project stakeholders intentionally use the shortest and thinnest rails possible to make the mechanical connection between the torque tube and the module. The difference is visible to the naked eye.
“The interaction between these components is where the term ‘big floppy modules’ comes from,” explains Theresa Barnes, who manages the Photovoltaic Reliability and System Performance Group at NREL. “A module is really a whole system, often consisting of glass, a perimeter frame, and a mounting rail. While glass has always been a structural element in the module system, it may be bearing more weight now, which may be bad because we have made the glass weaker.
Glass packaging and strengthening
As recently as 2020, monofacial PV product designs accounted for more than 80% of module shipments globally. Today, bifacial technologies are ubiquitous, especially in utility-scale applications. According to a recent International Energy Agency report, bifacial PV module market share exceeds 90% in utility-scale PV power plants currently under development globally, while single-axis trackers enjoy a 60% market share [7].
As the name suggests, bifacial solar technologies capture energy from both the front and back sides of a PV cell or module. While rear-side irradiance is largely diffuse and reflected, this additional energy capture provides bifacial gains in utility applications in the order of 2-10%,
depending on ground albedo and other factors. Stacking these bifacial gains atop typical tracker gains of 15-20%, relative to fixed-tilt designs, enables modern utilityscale PV power plants designs to lead all power generation technologies in terms of average LCOE.
To facilitate the trend toward larger and more powerful bifacial PV products, module companies have largely moved away from glass-plus-backsheet packaging in favour of a dual-glass designs that control weight and costs while optimising back-side light capture. Prior to 2020, manufacturers typically would have packaged monofacial cells within a sandwich consisting of a 3.2mm front glass superstrate and an opaque polymeric backsheet. Today, bifacial module manufacturers typically use 2.0mm glass for both front- and backside packaging material.
Based on typical breakage patterns, researchers at NREL have noted that standard 3.2mm solar glass appears to functionally meet the threshold for fully tempered safety glass, meaning it tends to break into relatively small and harmless fragments [1]. Meanwhile, the low-energy fracture patterns observed in 2.0mm dualglass products are indicative of decline in surface compression.
“What is interesting about glass as a structural material is that its strength is largely an extrinsic property, meaning it is not inherent to the glass itself,” explains James Webb, senior research manager for reliability sciences at Corning, a nearly 175-year-old glass manufacturer. “What dictates strength is largely what manufacturers do to the surface of the glass. Heat tempering adds compressive strength, which provides protection against surface flaws resulting from manufacturing processes, handling processes, or environment exposure that would otherwise limit the inherent strength of the glass.”
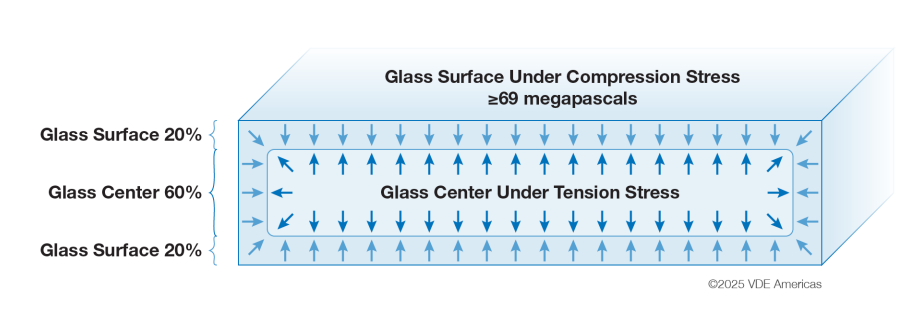
As part of a conventional high-volume manufacturing process, it is relatively straightforward for solar glass manufacturers to drive a thermal differential into 3.2-mm glass that results in a minimum surface tension of 69 megapascal (MPa) and meets the ASTM C1048-18 standard for fully tempered glass, as shown in Figure 3. Achieving the same level of strengthening in thinner glass is more challenging.
While it is technically possible to fully temper thinner 2.0mm glass, the manufacturing process control window is narrower, meaning procurement options are more limited. As glass gets thinner, more surface compression is required to achieve a given strength threshold. Moreover, the probability that a sheet of glass will contain a strength-limiting flaw or defect increases with sheet size. [8]
“Compressive strength in glass is not binary—it is a continuum,” notes Mike Pilliod, president and chief technical officer at Central Tension. “The ability to get a good temper crosses a threshold around 2.6mm, and you begin to reach the thermal tempering limits for fully tempered glass as you approach 2.0mm. With aluminium, normal manufacturing variances have little effect on fundamental material properties. With glass, you need a consistently good manufacturing system, as any processing flaws will limit compressive stress.”
Testing the structural limits
The same PV module can withstand different design loads depending on how it is mounted. In an optimally supported fixed-tilt configuration with perpendicular steel rails as load-bearing members, a PV module might be able to withstand a uniformly distributed design load as high as 5,400Pa. In a tracker mounted application with long unsupported cantilevers and short centre rails, load bearing capacity for the same module could drop below 1,600Pa.
To account for these different integration scenarios, the International Electrotechnical Commission (IEC) standard for terrestrial PV modules, IEC 61215-1:2021, allows module manufacturers to declare a design load specific to a particular installation method. This allowance lets product and system designers engineer substructures and foundations on a site-specific basis, adding or eliminating load-carrying capacity as needed to withstand expected wind or snow loads.
“In the laboratory, we apply a safety margin to the manufacturer’s self-declared design load and use this as the basis for our mechanical load tests,” says Cherif Kedir, president and CEO of RETC (Renewable Energy Test Center), part of the VDE Group. “For qualification purposes, we test one or two modules using a specific combination of field hardware. If something fails, the tracker manufacturer can test again, perhaps with longer or thicker rails. Eventually, this iterative process will identify a system of components that meets the design load.”
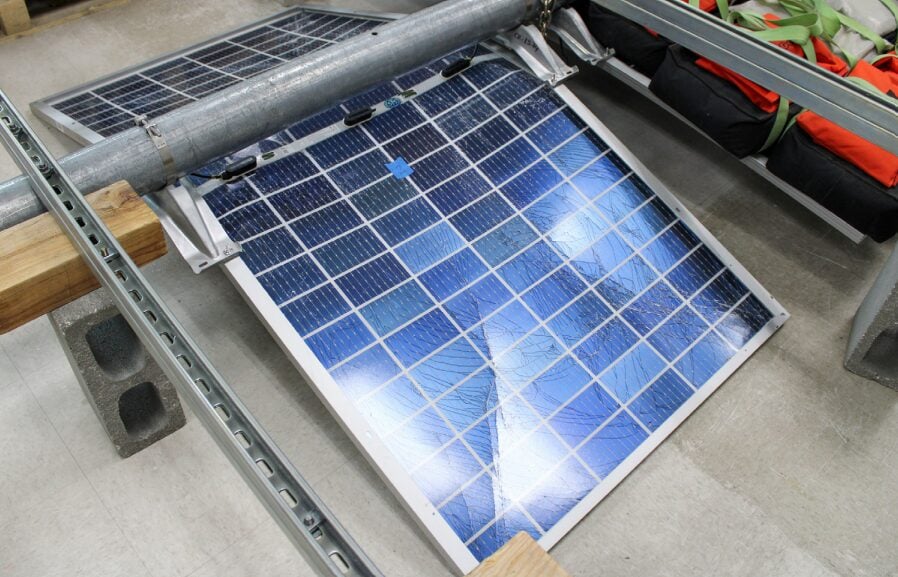
Unfortunately, testing a limited number of samples to IEC qualification standards sheds little to no light on the ways in which commercial products tend to fail or wear out prematurely under real-world conditions of use, as shown here in Figure 4. IEC 61215 is a safety standard. It is the minimum bar to market entry. It is not intended as a long-term reliability indicator.
“The industry should not solely be using IEC 61215 as a baseline mechanical standard for bankability,” says Frank Oudheusen, manager of Azimuth Advisory Services, a consultancy that specialises in structural technical due diligence and failure root cause assessment. “If you drive costs all the way down to the IEC 61215 standard, product evaluation does not guarantee a system will survive the 10,000-plus wind loading cycles associated with a single hurricane, let alone exposure to a second named storm or 20 years of field exposure. Frankly, it may not be able to withstand the expected wind gust pressure at tracker row ends in many parts of the United States.”
The case for breaking glass
One of the best ways to understand and prevent solar glass fracture in the field is to break more glass in the lab. This is especially true today, given that mechanical load tests based on IEC 61215 do not trigger field-observed low-energy glass fracture patterns in large-area dual-glass PV modules [9]. Until testing laboratories have a way to reliably recreate this failure mode, it will be difficult, if not impossible, to prevent spontaneous glass breakage in the field.
Testing to failure is one of the main tools Pilliod uses to make sense of complex fracture mechanics. “What really interests me as a glass reliability engineer is measurement systems that provide a statistically representative probability of failure. The use case doesn’t really matter. Automotive glass, cell phone displays, architectural glass, you name it. If you’re not breaking glass—and not testing a representative number of samples to failure—you are not doing your job as a reliability engineer.”
The problem with pass/fail testing paradigms, Pilliod explains, is that they stop too soon. “Okay, one module passed. But why did you stop? Keep going. Figure out where the sample fails. If you gradually increase the applied load and test a meaningful number of samples to failure, you can generate Weibull distribution curves that plot the probability of glass failure on a product, or bill of materials-specific basis with low uncertainty. Now you can stack these Weibull curves and compare them. Do the curves overlap? If not, you can be reasonably certain that there is a statistical difference in resiliency.”
Since glass fracture is probabilistic with a random distribution pattern, RETC and its sister company, VDE Americas, recently introduced a Weibull-based test-tofailure programme for hail. This so-called Hail Resiliency Curve (HRC) Test uses a calibrated air cannon to shoot progressively larger freezer ice balls, a laboratory proxy for naturally occurring hail, at increasingly higher speeds and impact energies until glass breakage occurs. By testing an entire pallet of modules (~20 samples) rather than only one or two, the HRC test provides a robust statistical representation of resilience or vulnerability in a population of modules [10].
This type of test-to-failure approach—perhaps conducted using dynamic mechanical load testing, shown in Figure 5—may also be useful as a way to understand the probability of low-energy glass fracture in today’s tracker-mounted bifacial PV systems.
“If a manufacturer sends half a million modules to a particular utility-scale solar project, that population will include a variety of stress profiles due to manufacturing process variability and other factors,” notes Kedir. “Each sheet of glass has a different stress profile based on the tempering process and includes different strength-limiting flaws. Drilling holes in the back-side glass changes that stress profile, as does glass patterning between cells to improve back-side light capture. Lamination and material handling processes effect the stress profile. The only way to understand these differences is to test more samples to failure.”
Standards to the rescue?
Though product qualification standards undoubtedly provide a possible pathway to engineering a return to reliability for dual-glass PV modules, it is not clear whether a critical mass of technical committee and working group members are in favour of more rigorous mechanical load testing.
Tracker systems are exposed to dynamic forces and cyclical wind loading in real-world applications, but the product qualification standards do not hold manufacturers to a standard of fatigue life. Similarly, real world wind and snow loads are typically unbalanced in nature rather than uniform, but proposals to add unbalanced load testing guidelines to IEC standards have not made it out of committee.
These persistent gaps between the standards and reality are frustrating for Lauren Busby Asher, vice president of engineering at steel solar frame specialist, Origami Solar. “If module manufacturers made the switch to our high-strength steel frames in place of traditional aluminium perimeter frames, utility-scale solar projects would be considerably stronger and more reliable than they are today. We know this because we have conducted side-by-side tests to failure that validate our product’s ability to achieve higher load ratings and safety margins. But the current qualification standards let companies lower their design load ratings, test one module and call it a day.”
According to Kedir, standards simply cannot address everything. “Generally speaking, the working groups that write product qualification tests allow manufacturers to push certain design limits with the understanding that the industry will police itself. If the standards groups could force the module manufacturers to test the edge of their processes and test-to-failure, that could be good for the industry. But I don’t think you can rely on the standards to govern every possible installation method, simply because technical committees take years to release or update a standard.”
At the end of the day, accelerated time frames between innovation and mass production are precisely what have allowed the solar industry to cross the grid parity threshold to become the leading source of new power generation capacity. This is an agile industry, one in which technical advancements appear move at the speed of light as compared to the slow and steady march toward consensus on codes and standards.
Raising the bar for bankability
Solar glass fracture is a probabilistic event that occurs based on a combination of internal and external factors, many of which are hiding in plain sight.
As an example, module manufacturers have largely continued to treat solar glass as a commodity meaning it is rarely subject to batch traceability or lot tracking—even though tempering process control becomes more important as modules get bigger, as shown in Figure 6. Meanwhile, forensic analysis has revealed evidence that glass supply chain plays at least some role in the proliferation of low-energy glass fracture.
“A developer came to RETC recently with two side-by-side projects,” recounts Kedir. “While both sites used modules from the same manufacturer, the number of cracks exhibited on one site was an order of magnitude higher than the other. Testing modules from the site experiencing glass failure, we found that 75% of samples tested under the design load rating. It turned out that the modules at these side-by-side sites came from two different production lines, each supplied by a different glass manufacturer.”
If a change in glass vendor at the point of production can account for an order of magnitude difference in early mortality in the field, why isn’t this variable part of a standard bill of materials (BOM) verification process?
From my perspective as a technical advisor who helps de-risk large utility-scale solar projects, identifying and procuring resilient BOMs requires traceability, transparency and data. After all, that is one of the main ways independent engineers, owner’s engineers and consulting engineers ensure fielded projects can withstand site-specific conditions of use while optimising investor returns.
Given that collective action is required to prevent today’s infant mortality issues from stymying tomorrow’s growth, the role of the industry’s technical due diligence community is more important than ever. Reliability engineers have a responsibility to help module and tracker companies make fielded systems as inexpensive as possible, but not so cheap that upfront cost savings drive up operational expenses.
Scientific researchers and testing laboratories have a responsibility to help industry stakeholders identify the root causes of low-energy glass fracture and develop new test sequences that screen for field observed failure modes. Technical advisors have a responsibility to demand better data than vague module datasheet glass descriptors such as “semi-tempered”, “half-tempered” or “heat treated”.
Further downstream, system developers, owners and operators, and EPC firms have a responsibility to make science- and engineering-based decisions regarding product procurement and deployment. Last but not least, project financiers and insurers have a responsibility to raise the minimum bar for bankability and provide differentiated terms and conditions for projects that meet or exceed these best practices.
References
[1] Silverman, T., et al, 2024, “Tough Break: Many Factors Make Glass Breakage More Likely,” National Renewable Energy Laboratory, Technical Report, NREL/TP-5K00-91695.
[2] Braga, M., et. al, 2023, “Investigating the causes and consequences of glass cracks on double-glass large area bifacial PV modules,” NREL PV Reliability Workshop, Poster Presentation.
[3] Wang, D., 2024, “Wind speed and rear glass breakage on bifacial PV module mounted on trackers,” DNV white paper.
[4] Solar Energy Technologies Office, “2020 Utility-Scale Solar Goal Achieved,” U.S. Department of Energy, Online, September 12, 2017.
[5] IRENA, 2020, “Renewable Power Generation Costs in 2019,” International Renewable Energy Agency, Abu Dabi.
[6] Lazard, “2025 Levelized Cost of Energy+,” June 2025.
[7] IEA, 2024, “Best Practices for the Optimization of Bifacial Photovoltaic Tracking Systems Bifacial,” International Energy Agency Photovoltaic Power Systems Programme Technical Collaboration Program (IEC PVPS TCP).
[8] Palmiotti, E., et al, 2025, “Growing Panes: Investigating the PV Technology Trends Behind Frequent Early Failures in Modern Glass–Glass Modules,” IEEE Journal of Photovoltaics, Vol. 15, No. 2.
[9] Markert, J., et al, 2025, “What Can We Learn from the Comparison of Glass Breakage between Lab and Field,” Franhoffer ISE, SOPHIA Workshop 2025.
[10] RETC, “2025 PV Module Index Report,” Renewable Energy Test Center, June 2025.
Author
David Devir has over two decades of global product, project and programme management experience in the renewable energy industry. As a principal engineer for VDE Americas—a wholly owned subsidiary of one of the largest technology organisations in Europe—David helps advance the deployment of large scale solar and energy storage projects that are financeable and insurable. Previously, he spent much of his career optimising critical solar energy components, including power conversion devices, energy storage systems and single-axis trackers. David holds a bachelor of science degree in mechanical engineering from Alfred University.


