Equipment-driven underperformance in PV power plants has tripled over the past five years. With PV becoming a cornerstone of the global power system, operators must shift from reactive troubleshooting to data-driven O&M strategies, write Avery Black, Leo Kim and Don Nista of Raptor Maps.
The solar industry has expanded at an unprecedented pace, surpassing 2TW of installed capacity in 2024—just two years after reaching 1TW [1]. This rapid expansion has been fuelled by increasing global energy demand and the favourable economics and technological advancements of PV technology. However, the industry’s emphasis on growth has exacerbated existing issues with power loss and long-term site health. Equipment-driven underperformance has tripled over the past five years, highlighting the urgent need for improved operations and maintenance (O&M) [2].
Try Premium for just $1
- Full premium access for the first month at only $1
- Converts to an annual rate after 30 days unless cancelled
- Cancel anytime during the trial period
Premium Benefits
- Expert industry analysis and interviews
- Digital access to PV Tech Power journal
- Exclusive event discounts
Or get the full Premium subscription right away
Or continue reading this article for free
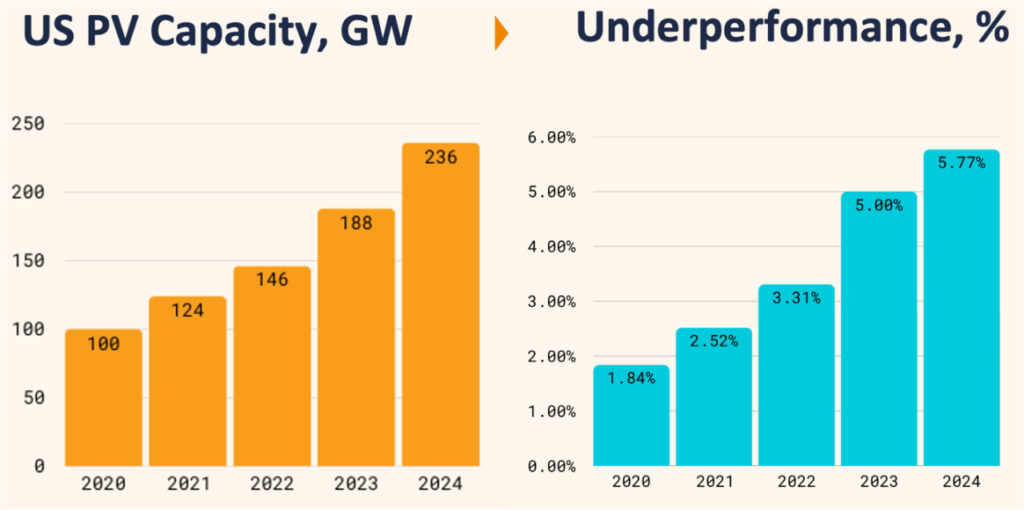
The rise in underperformance has come as a result of new challenges emerging as the industry scales. As the global installed capacity of solar increases, the industry is also building larger projects, with some projects being measured in gigawatts not megawatts. In regions such as Texas, the average project size of utility-scale sites under construction reached 197MWac in 2024 [3]. The upscaling means that much more work must be done by solar companies to maintain high-quality farms, especially with increased development on remote, weather-vulnerable lands. With power capacity loss reaching 5.77% in 2024, the inability to optimise operations could result in billions of dollars in lost revenue over time (a potential US$10 billion problem globally in 2024 [4]). Therefore, the focus must shift towards performance intelligence and data-driven solutions that can sustain long-term operational success, as energy security and rising global electricity demand rely on a healthy and robust solar industry.
Given the increasing reliance on renewable energy to meet global electricity demand, properly addressing issues causing power loss over the full 25+ year lifecycle can be an efficient solution to improve profitability and energy security.
The role of labour in successful operations
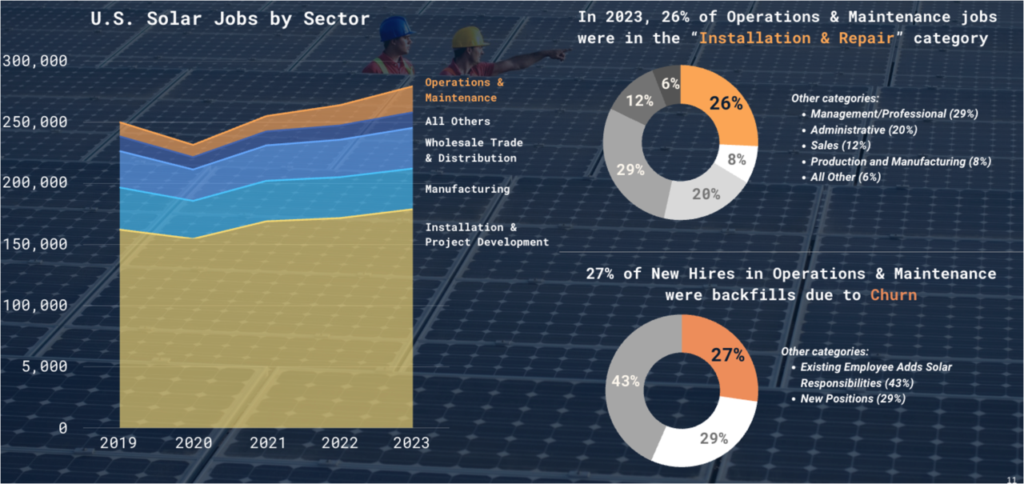
The gap in solar operations and equipment performance is commonly seen and felt through the lens of labour constraints. Despite the increasing power loss across solar assets, O&M budgets remained constrained. In the US, only 7.65% of solar jobs are allocated to O&M, with just 26% of those focused on “installation and repair” [5]. Meanwhile, power loss has reached 5.77% as of 2024, suggesting a disconnect between capital allocation and operational effectiveness [6].
These three key challenges have emerged to compound labour constraints in solar operations:
- High turnover rates: employers are having difficulties hiring for solar jobs and 27% of O&M employees leave their roles each year, making it difficult to maintain an experienced workforce [7]
- Budget constraints: O&M budgets are often set in advance, sometimes during project financing, where optimistic cost projections can underestimate unforeseen circumstances
- Competitive market pressures: O&M providers are being squeezed on pricing to secure contracts with customers, limiting their resources for effective maintenance
Beyond these selected issues, a systemic shift in industry priorities is necessary. While project financing is often structured to minimise upfront costs, properly allocating resources towards O&M can reduce the likelihood of escalated expenses in the long run. Given that 70% of O&M costs stem from labour-based inflationary costs [8], inefficiencies in workforce deployment only add to financial strain.
How do we adjust for labour constraints?
- Traditional solution: allocate more money toward boots-on-the-ground efforts and experienced full-time employees (FTEs)
- Scalable solution: invest in systems that deploy boots-on-the-ground resources more efficiently and minimise the need for investigative or inspection truck rolls
In any case, the average solar farm has nearly 6% of recoverable DC losses that should be addressed.
State of solar performance
Five consecutive years of increasing power loss makes one thing certain: performance will not improve without action. Solar farms in our 2024 dataset experienced an average of 249 anomalous events per megawatt per year, creating resourcing challenges for remediation, preventative maintenance and monitoring [9]. Even assuming one-third of these issues are addressable, a plant manager on a 100MW utility-scale site is still trying to manage around 8,000 equipment defects a year. This is a daunting task on top of the other responsibilities O&M teams must handle, such as compliance-related tasks, maintaining civil works, inspecting for thermal events in high-voltage equipment, etc.
Right now, we hear from our most understaffed sites that technicians are stuck “fighting fires” – i.e. failures with the largest equipment at the solar site force them to constantly be reactive. In poorly performing sites, typically larger system-level issues are more prevalent and drive power loss. More sites are following this trend year over year, and 2024 was no different.
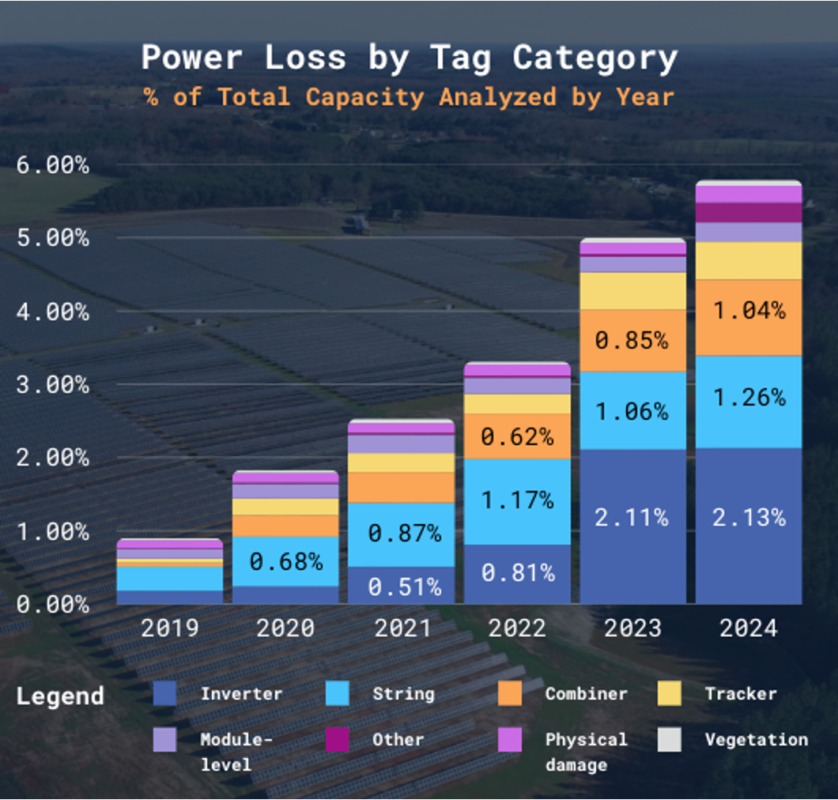
The most prevalent system-level failure points this year:
- Inverters: the largest DC health component was responsible for approximately 40% of site underperformance [10]
- Combiners and strings: experiencing year-over-year issue increases of 22% and 19%, respectively [11]
- Trackers: malfunctioning trackers accounted for 9%+ of overall DC losses and likely made a larger impact if you assume that any improperly stowed trackers were responsible for a portion of the observed 80% increase in damaged modules [12]
It is crucial to recognise that underperformance is not limited to large-scale issues; module-level problems can escalate with overheating modules and components, presenting re and equipment damage risks. For example, a 0.01% increase in damaged modules can increase the duration of ground fault-related downtime sixfold [13]. To successfully operate a healthy solar asset, there is a need to manage both system-level and module-level concerns. Correctly addressing smaller, high-risk issues before they worsen is important and made more difficult when teams are resource-constrained.
Breaking the ‘troubleshooting loop’
Traditional solar maintenance relies heavily on reactive approaches, often leading to inefficient troubleshooting cycles:
- Remote Operations Center (ROC) validates an alarm via data analysis
- A technician is dispatched following an alert or failure
- The technician arrives on-site with limited information, requiring manual root-cause analysis
- If the issue cannot be resolved, a second visit is needed with the necessary tools and materials
- Lack of documentation prevents technicians from identifying recurring issues or equipment patterns
- Temporary fixes are applied, but without preventative action, the same equipment failures and process failures recur
This reactive cycle results in increased windshield time, a higher mean-time-to-repair, and higher operating costs.
A primary goal for O&M teams should be breaking this loop. Collecting data via flexible and remote means can enable smarter, faster decision-making. Ultimately, deploying technicians after understanding what is needed on-site reduces windshield time and mobilisation costs. Additionally, building capabilities around performance intelligence can support better documentation of past issues and predictive analytics. The end goal is clear: empower O&M teams to arrive on-site prepared with the right tools, PPE and replacement parts to safely remediate issues impacting power production.
Technology-driven solutions
To address these inefficiencies, the industry is shifting toward performance intelligence through automation and analytics. Best-in-class companies leverage the following:
Robotics, automation and targeted inspections
Solar asset optimisation must be approached with a long-term perspective, as sites typically operate over a 25-year lifecycle or longer. After the initial surge of development, construction and commissioning, maintaining performance and reliability becomes the central challenge. To support this, robotics and automation are playing an increasingly critical role in sustaining long-term operational performance. Effectively managing utility-scale solar, both the largest sites with dedicated technicians overseeing daily maintenance and O&M contractors who may manage many sites with one crew, will not get easier without limiting labour-intensive tasks. Moving forward, the industry is evolving its technology stack as larger, more remote sites need frequent touchpoints and mobilisations.
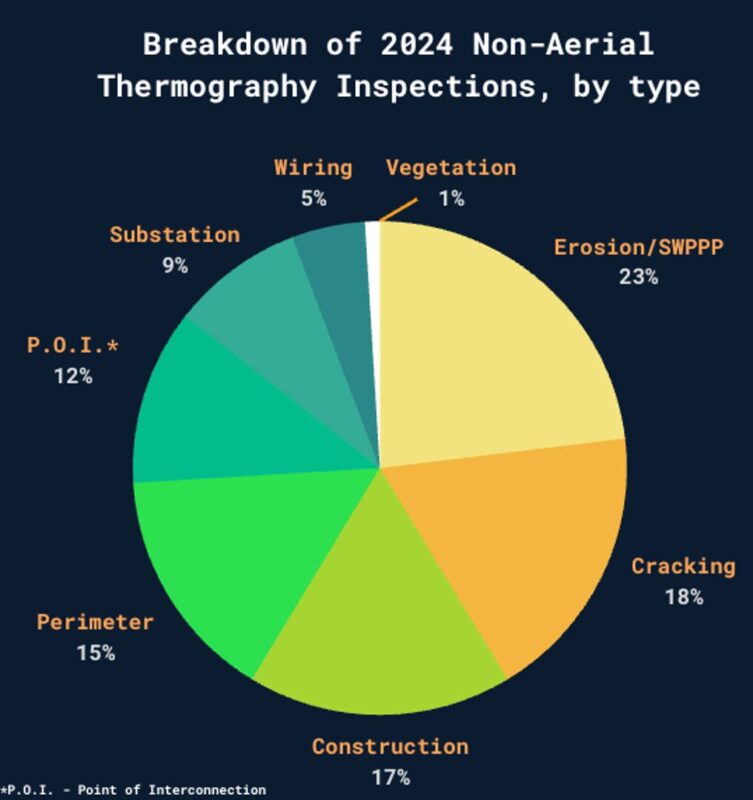
This shift toward automation is reflected in real-world operations, as seen with Raptor Maps customers, where onsite teams increased their aerial inspection frequency by 70% in 2024 compared to the previous year [14]. Much of this growth is attributed to automated inspections replacing previously manual processes in areas such as inspecting substations, vegetation growth, and erosion issues on-site. Furthermore, as operators look to transition from reparative to preventative maintenance, specialised inspections—such as those focused on cracking and wiring—have become key to addressing minor defects before they develop into larger system failures. In 2024, these inspections accounted for over 23% of non-IR aerial assessments, demonstrating a growing focus on early intervention [15]. Beyond recovering power loss, these use cases allow technicians to focus on remediation, saving time and reducing the likelihood of fire hazards and ground faults caused by damaged equipment.
AI and software powering efficient operations
Historically, owners and operators are limited by the capabilities of traditional SCADA/DAS systems that only provide combiner-level data. These systems also include static site maps and manual data collection, which can be reactive, time consuming and inconsistent. Recent innovations in AI software and robotics are transforming solar operations by offering solutions that are automated and repeatable. Results from these innovations are more granular insights and prioritised/ actionable reports that help operators streamline the decision-making process and maximise system output.
Despite improvements in manufacturing and installation, problems arising from equipment failures and defects are seen across portfolios, so regular maintenance is still critical. Yet, many O&M teams continue to rely on monitoring systems that are not able to support root cause analysis or the localisation of problems on-site. Improving the data processing tools used during solar inspections can unlock new capabilities where anomaly detection becomes faster and more accurate. Many top performers are using AI-powered solutions that can provide quick and detailed insights for faster and smarter decision making, and optimising time spent on-site by their O&M teams.
Enhanced data transparency
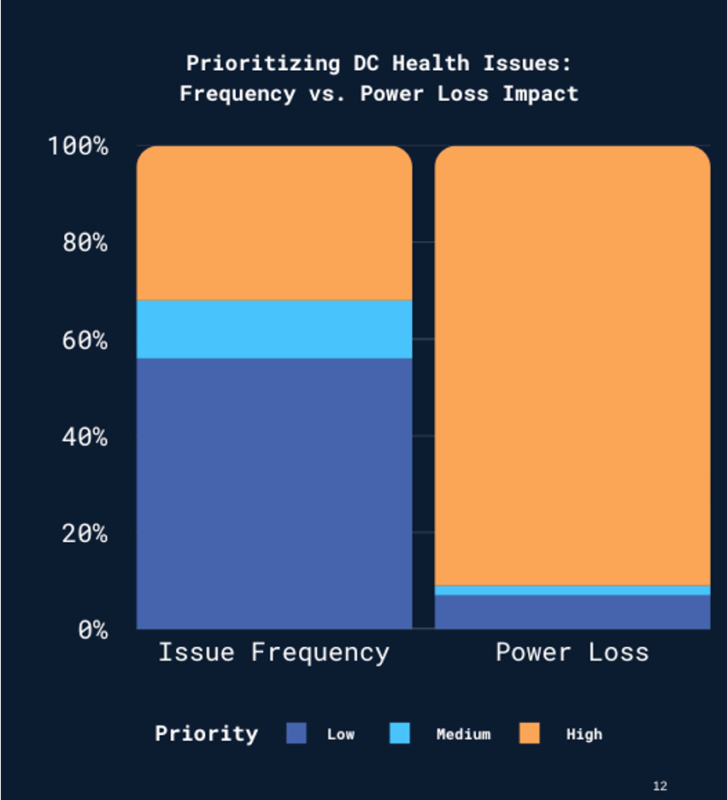
High-priority issues account for 90% of power loss but only 40% of tagged issues, which intuitively makes sense, as larger equipment failures (e.g. inverters or combiners) impact exponentially more capacity than a single module defect [16]. Despite this, traditional solutions have proven insufficient, as power loss continues to rise. This challenge affects sites of all sizes, with high-priority issues—defined as issues with the largest financial impact or risk factor—making up 80 to 90% of the power production loss in 2024 [17].
At the same time, software presents a critical opportunity to enhance performance by prioritising and documenting granular module issues. While low-level module and sub-module defects may seem insignificant (accounting for only 20% of power loss in systems under 5MW and less than 9% across all sites), tracking trends in module damage and defects can reveal broader site-level patterns that demand attention [18]. Ensuring data transparency in these areas is essential for identifying systemic risks and implementing proactive or preventative solutions before they escalate.
Final thoughts
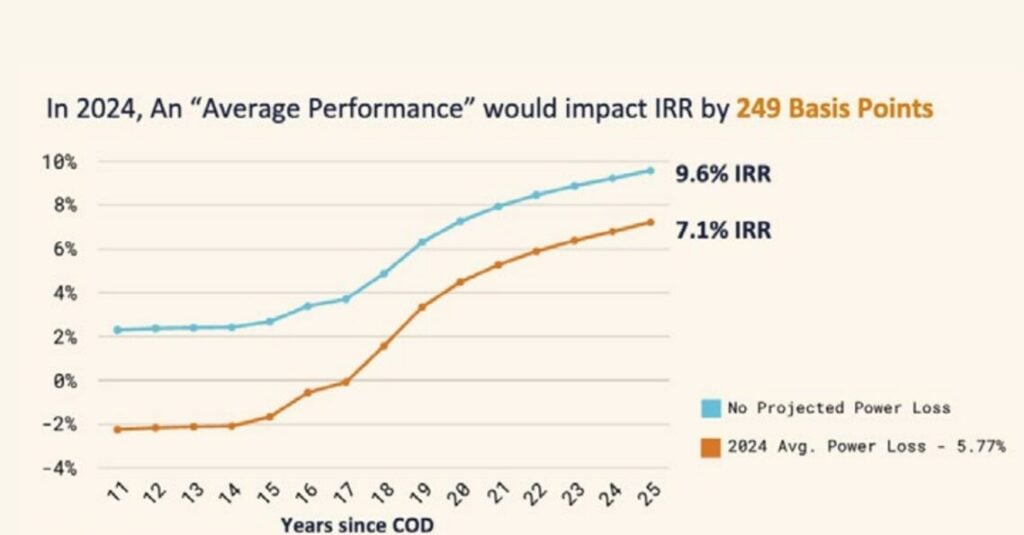
Underperformance across solar assets results in an average annual financial impact of US$5,700-6,000 per megawatt [19]. Over the course of a project’s lifecycle, this ineffciency can reduce internal rates of return (IRR) by up to 249 basis points [20]. As the industry continues to scale, operators must shift from reactive troubleshooting to data-driven O&M strategies. Decision makers are leaving a lot of money on the table and the trends in solar data speak for themselves. For example:
- In 2023, It was estimated that owners were still underappreciating the effects of weather events in financial models by 300+% [21]
- In 2024, the rate of anomalous modules increased by 80% and underperformance rose for the fifth straight year [22]
The impact of implementing the solutions outlined in this article cannot be overstated. With solar playing a critical role in the global energy transition, the efficient operation of these projects is imperative.
References
[1] “Solar PV power capacity in the Net Zero Scenario, 2015-2030.” IEA, www.iea.org/data-andstatistics/charts/solar-pv-power-capacity-in-the-net-zero-scenario-2015-2030
[2, 4, 6, 9-12, 14-19, 22] “Global Solar Report: 2025 Edition.” Raptor Maps, https://raptormaps.com/resources/2025-global-solar-report
[3] “Major Projects List.” SEIA, https://seia.org/research-resources/major-solar-projects-list/
[5][7] “National Solar Jobs Census.” IREC, 2024, https://irecusa.org/census-solar-job-trends/
[8] “Episode 8 of Power Players Podcast: The True Cost of Solar O&M is Increasing.” Origis Energy, https://origisenergy.com/insights/the-true-cost-of-solar-om-is-increasinginsights/
[13] “Module Breakage Impacts on System Availability” Silicon Ranch Presentation, 2021, https://www.siliconranch.com/
[20] “PPA Single Owner cash flow model.” NREL https://sam.nrel.gov/financial-models.html & Adjusted with Raptor Maps Internal Analysis
[21] “Solar Risk Assessment.” kWh Analytics, 2024, https://www.kwhanalytics.com/solar-riskassessment
Authors
Avery Black currently works on the growth strategy team at Raptor Maps, developing the business case and strategy for deploying autonomous robotics and analytical software on solar sites. Prior to Raptor Maps, Avery worked for McKinsey & Co., consulting on the development and investment in large capital projects. Avery graduated from the University of Virginia with a B.Sc in chemical engineering.
Leo Kim is the director of marketing and growth at Raptor Maps. Over the past ten years, Leo has worked across the industrial and energy sectors, supporting companies to drive process optimisation, digitalisation and AI implementation across their businesses. Leo graduated from Harvard University with an A.B. in government and statistics.
Don Nista has more than a decade of experience in the solar industry. His standout accomplishments include building out O&M infrastructure from 24MW to 2.5GW and defining strategy for third-party operations on over 4GW of utility-scale facilities. Don served as the director of O&M for SB Energy, a vice president of O&M for Goldman Sachs, and a vice president of O&M at Cypress Creek Renewables.


