The past few weeks has seen some of the most dramatic knee-jerk, naïve and misinformed PV market reporting seen in recent times, with the headlines often resembling nothing more than tabloid sensationalism.
In fact, for most of 2018, the confusion across the board within the market research community has been evident, perhaps reflecting the gap today between those that ship the product and those that seek to track from afar on a spreadsheet.
Try Premium for just $1
- Full premium access for the first month at only $1
- Converts to an annual rate after 30 days unless cancelled
- Cancel anytime during the trial period
Premium Benefits
- Expert industry analysis and interviews
- Digital access to PV Tech Power journal
- Exclusive event discounts
Or get the full Premium subscription right away
Or continue reading this article for free
This article discusses why the fascination on these tabloid rumblings is creating a false narrative that is neglecting the fundamental issues today in the PV industry. The sections covered below seek to highlight the real issues that need to be considered to fully understand manufacturing supply-chain supply/demand, cost/pricing and technology progress at the shipped module level.
I start by stepping back from the May madness post-SNEC, and put the first half of PV activity in 2018 into perspective. This takes us neatly onto the topic of China’s investment time-bomb that has been brewing for about 3 years but is now ready to create changes, ending with what can realistically be expected with cost and pricing at the end of 2018 and the technology-question of the day (mono versus multi).
The narrative here is very much based on qualitative reasoning, with the focus on trying to explain clearly in words what is going on globally. The quantitative argumentation behind the themes and conclusions will be covered in a PV-Tech webinar I will deliver online on 27-28 June. Details to register to hear the webinars can be found here.
PV forecasting is a thankless task, at the best of times
Forecasting global PV demand has long been challenging, largely due to the sheer volume of companies shipping modules to the end-market. The PV industry continues to have a highly fragmented route-to-market for modules, with the top-20 module suppliers making up about two-thirds of demand of whom only a few deliver guidance that can be tracked with any accuracy. It creates a virtually impossible task for outside observers.
The default route for forecasting demand has routinely been to look at country-specific PV policies, auctions or long-term aspirations. However, with many of these being government advocated, it then places supreme trust in the will of the policy makers coming to fruition.
Markets that are attractive and uncapped tend to be flooded with product, and compared to all other new energy sources, PV can be deployed at a phenomenal rate. Almost always, it takes policy makers months to react to unexpected exploitation by return-driven investors, by which time installations can vastly exceed original forecasts.
These issues are largely the main reasons why demand forecasting has been so hard to undertake until now in the PV industry. In the past couple of years though, it has hit new heights as the culprit in this case has been a country accounting for half of global demand – China. And for the whole of 2018, it is China that has single-handedly created the confusion in terms of forecasting global demand, and will continue to do so in the short-term.
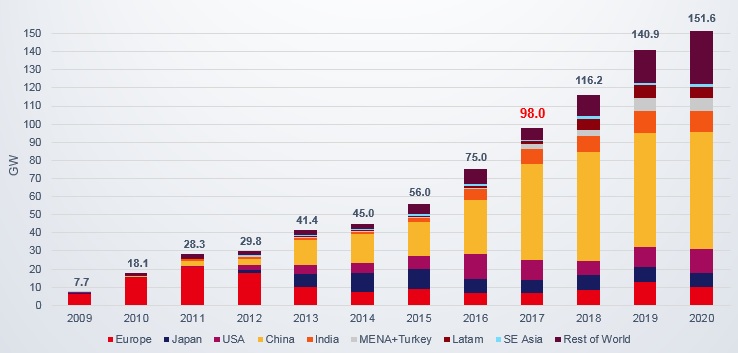
Before May 2018, it is fair to say that no-one appeared to have a good handle on what demand was going to be in China this year. Forecasts ranged from 30GW to about 70GW, which is such a massive range that the global numbers for 2018, from 90GW to 130GW, simply emphasized that the current means of market forecasting are perhaps needing an overhaul.
Now, when we factor in the announcement from China’s National Development and Reform Commission, the Ministry of Finance and the National Energy Administration outlined in the “2018 Solar PV Power Generation Notice” – suggesting the real possibility of imminent deployment caps, a reduction to domestic feed-in tariffs rates, and setting rules at the central government level for utility-scale projects – then we definitely have the basis for confusion on a level not seen before.
Within 48 hours, 10-30GW was slashed from previous 2018 demand forecasts, with disastrous consequences being advocated that would ‘shake-out’, ‘consolidate’ and restructure the PV industry, as millions of workers in China were sent back to their villages as factory production at hundreds of PV plants ground to a halt.
It almost suggested the industry had been in a harmonious supply/demand existence, and this dramatic press release from China had come out of nowhere, and the future would never be the same again.
How wrong, naïve and misleading these summations may end up in just a few months from now. In the next section, I start to explain why.
Arrival of the next downturn has been unsubtle and depressingly inevitable
When annual deployment of PV in China hit the 10GW mark several years ago, analysts across the board concluded that this was an upper limit to demand in China and drew a flat line with a ruler going forward forecasting a stable 10GW per year in China almost ad infinitum.
The reality was a 10GW to 50GW domestic market surge that fuelled Chinese manufacturing investments from dozens of companies spanning the polysilicon to module value-chain stages, and even saw new entrants keen to jump on the bandwagon with multi-GW factory additions.
By the end of 2017, it seemed to reach feverous proportions, with new 50,000 MT polysilicon factories being accelerated, cell makers proclaiming 3-year plans to add tens of GW of new capacity, and ingot pulling plans that were destined to go ahead, come what may.
The question was not if this would create a problem for manufacturing, but simply when.
Behind the optimism was often the justification to come out of a shakeout as a top-5 player in China, where the government would then assign favoured-status and secured investments would be bankrolled at zero-risk. Sadly we have been here before. The only difference today is that the 1GW threshold has been replaced by 10GW, as a metric for long-term competitiveness.
If such aspirations were restricted to just a few players, then maybe things would not have been so bad. But when you have dozens of Chinese companies across the c-Si value-chain wanting to move from 1GW to 5GW, 5GW to 10GW, and 10GW to 20GW, there is clearly a problem brewing that will inevitably come to a head. (Add in the capacity being largely me-too and not technology differentiated and we have further problems on hand.)
The timing of when this juggernaut of capacity expansion investments would result in chaos was largely governed by the point at which China finally realised that it had a supply-driven deployment environment that was positioning to move the 50GW annual domestic number to 100GW during 2019.
In the absence of government intervention, it would simply have self-imploded, by virtue of module supply levels growing faster than developers and EPCs could cope with. That tipping point was likely to arrive in the second half of 2018 regardless of the May announcements from China concerning policy adjustments.
Domestic China supply/demand has been walking on a tightrope for the past 18 months, supported only by the lack of raw material to make wafers and cells. Once polysilicon hits oversupply, we get to the point that downstream parts of the value-chain collapse with the demand simply not being there to absorb modules at the rate they are being produced.
The net result is downturn, and the basic factors are no different to what we saw in 2012, except we have moved from problems at the GW-level (back in 2012/2013) to ones at 10GW or more.
What does a 2018/2019 downturn look like?
When the industry had its 2012/2013 downturn, capex was hit almost instantly with equipment suppliers seeing new order intakes reduced instantly, manufacturing gross margins moved from 10-20% to 0-5%, and module pricing gravitated to a baseline level that allowed loss making for the market leaders to be absorbed without devastating consequences.
Should we expect anything different this time? Probably not.
However, perhaps the most relevant metric to explore here is where baseline module ASPs end up. This is not actually too difficult to do, and I will attempt to undertake this now.

The supply tightness at the polysilicon level, coupled with the market dominance of leading multi and mono wafer suppliers in China, over the past couple of years, has resulted in reported accounts from the leading upstream (poly/wafer) Chinese companies claiming gross margins ranging anywhere from 20 to 40%, or even higher on a quarterly basis.
In fact, the imbalance of profits seen at the polysilicon and wafer level within China has been a source of annoyance for cell/module producers for some time. Why should they have 40% gross margin, when cells and modules are generally single-digit? It has only been a matter of time before Chinese upstream poly/wafer margins were eroded, and we could be at that point now.
So, in looking at the near-term baseline module ASPs, the first thing we need to do is take down $/kg poly ASPs and per-piece wafer prices, such that the major players (not the loss making second tier producers) have gross margins eroded to the 5% level. Then we assume that cell and module production continues somewhat as a zero-sum-game, with the likes of JinkoSolar and Canadian Solar being able to command brand/performance premium levels a few percentage points above this.
This exercise takes about 15 minutes on the back of an envelope, but is potentially remarkably accurate in the grand scheme of things. So, here goes….
For reasons that will emerge in the following section of this article, it is actually more useful to adopt the silicon and non-silicon cost breakdown segmentation, when looking at overall module costs and resulting ASPs (as close as we can to a full COGS type analysis that has some form of commonality with accepted Chinese and western accounting practices).
Taking polysilicon ASPs to 10% above the best-in-class costs (cash plus depreciation) would flatline poly at about 10$/kg. Driving down wafer margins in China (again across the likes of GCL and LONGi) would then result in wafer ASPs sub-10c/W. Adding in realistic cell and module costs, and we end up with silicon costs at sub-5c/W and non-silicon costs at 19c/W, resulting in all-in (blended) module production costs at 24c/W.
Assuming then that module makers are posting 5% gross margins, we end up with a module ASP baseline of about 25-26c/W. This then has multi modules selling at the low 20c/W level (potentially heralding the first news of sub-20c/W sales from ad-hoc fire sales), mainstream mono PERC modules at say 27c/W and premium brand p-type mono-PERC modules at 28-29c/W.
Scaling rooftop and n-type variants is then performed purely on a pro-rated basis, with virtually nothing selling anymore north of 40c/W before long.
If it turns out that loss-making is more prevalent across greater parts of the value-chain, then we can possibly take another 5-10% off the above ASPs, but this would be a rather depressed sector getting saddled with debt and having to focus on a further round of draconian supply-chain cost reductions to return to break-even operating status.
The main question is when this occurs, and this will ultimately depend on what happens in China – on both supply and demand fronts. It may be late 2018, or delayed into 2019, but is does seem a path now on module ASP erosion that is simply unavoidable.
Who are the winners in the next downturn solar world?
The natural conclusion is to state that developers, EPCs, investors and asset owners will benefit the most, not to forget the humble private homeowner of course. This has been widely proclaimed by media outlets, almost like some kind of eureka-moment in time.
It is not rocket science, but there are secondary issues that impact on new developments and project financing when manufacturing stocks start to collapse, and investor confidence in the sector as a whole softens or concerns arise that assets are being populated by product coming from fragile loss-making producers.
In the upstream, there are no winners, unless you had the foresight and wisdom to have a secure long-term sales pipeline and the ability to lock customers into legally-binding ASPs that were not index-linked in any way to third-party Asian spot market price reports, nor at risk from force majeure.
Interestingly it would appear only one company in the solar industry succeeded in doing this, and this company does not produce in China and does not make c-Si panels, and may soon look at Section 201 as being a gift of a lifetime.
But there are some relative winners across the upstream segment that will largely by luck find themselves in the right-place at the right-time; so let’s explore this now as it is potentially more critical in terms of manufacturing competitiveness, in particular from a China standpoint.
If you scan back through the archives of PV manufacturing then many will remember the days when there was a rush to be fully vertically-integrated, as far back as polysilicon, but at least covering the ingot-to-module stages. When polysilicon ASPs then enacted their major price decline from the days of 300$/kg to 30$/kg, companies that were free to purchase outside of long-term contracts found themselves in pole position.
Then during the 2012/2013 downturn, companies that were reliant on buying in cheap wafers (for cell/module operations) or simply cells for module-only activities had a key advantage over the ingot-to-module companies.
The term ‘flexible-buying-strategy’ then became a marker when comparing fully-blended prices that were often hampered by in-house costs being higher than third-party component availability. (Expect the ‘flexible manufacturing’ phrase to return with a vengeance very soon!)
The pending downturn is likely to see the final scenario unfolding, where companies that are top-heavy with cell/module capacity have a better cost structure when buying in wafers, than relying on their own in-house supply channels.
This creates an interesting dynamic then going forward, as there have been significant moves from some of the multi-GW module suppliers of recent to bolster ingot/wafer capacity. It may simply be that the companies that invested in adding mono pulling end up the winners within a multi oversupplied wafer climate. More on this below now as we shift to the ramifications for the mono-versus-multi balance.
Mono adoption almost certain to be fast-tracked now with muted objections
Just over a year ago, we ran a feature on PV Tech talking about the rate of market-share shift from multi to mono, and the factors behind this; see Mono and multi production 50:50 in 2018, but mono is the future.
The thesis was based on the assumption that the move to mono was happening at a rapid rate, and would before long see mono c-Si production levels at parity with multi, and then moving to a more dominant position out to 2020.
In this piece, I laid out the factors that would ultimately dictate the rate of market-share gains from mono, with two main caveats, copy and pasted from the May 2017 article as follows:
a) If the industry contracts, or even remains static, it will only increase the rate of mono market-share gains over multi, as mono is tight in supply and has the scope to be competitive with multi now. In this scenario, multi is wiped out faster than expected.
b) Conversely, if the market over-performs, and ends up over 85GW [for 2017] (don’t discount for one second), then multi has a lifeline due to the supply constraints of mono. And potentially more time to get its act together for low cost wafering and cell efficiency improvements.
What unfolded in 2017 fell firmly into scenario b) above, and the final annual production level of more than 100GW in 2017 meant that mono ended up with just 33% of the c-Si market-share. During the first half of 2018, mono managed to nudge up a few more percentage points, reaching 38%, and pending a real shift in deployment of modules in China during 2H’18, was heading for an overall market-share in 2018 of about 40%.
However, what the downturn now does is flip the mono/multi equation firmly over to scenario a) above, and will accelerate mono levels closer to the 50% tipping point during 2019, or at the very latest 2020.
Despite all the ambitions of those left with multi-GW of ingot casting, or recently-installed diamond wire sawing of multi wafers, multi has only cost to play with to stay competitive until enough mono pullers exist in the world to fully eliminate multi from the production mix. This may not happen for a further 5 years however, so plenty of time for multi to still have one final say in the PV industry, by setting lower and lower module ASPs that pull down the pricing on anything mono being shipped.
But maybe it’s a good idea to revisit this hypothesis in 12 months! Something will almost certainly happen that tweaks the mono/multi equation a bit more either way. However, the two scenarios above look likely to remain the basis of mono/multi share splits for some time.
What China should do next to control its PV sector
So, let’s leave the best until last in the article, with a sub-title that could occupy academics and industry panel discussions for years to come, and try to answer this with twitter-like brevity.
Before laying out what I think needs to happen, let’s set the record straight on one thing. The impending downturn is not happening because of a PR from public bodies in China in late May 2018. It is the unavoidable consequence of 2-3 years of chronic over investment across the c-Si value-chain within China that was a time-bomb waiting to explode.
The PV industry operates on cyclic investment phases, and after every upturn, there is a downturn. It is not scaremongering to say a downturn is coming!
Global capex across the c-Si value-chain (ingot-to-module) doubled between 2015 and 2017, with China alone investing more than US$10 billion, and accounting for between 60-70% of global manufacturing investment here. Add in here the >US$3 billion ploughed into polysilicon factories during this period, and we can see the problems now ready to impact margins.
But this is just the starting point. The even bigger issue now comes from the 2017-stimulated euphoria in China from the 5-10-20GW expansion plans, some of which are done, midway through, and are set to happen, come-what-may!
It almost seems incredible to the outside world that a company would choose to increase production of anything by a factor of 10 within a year, with no sales pipeline to fulfil! Or have an ambitious global expansion strategy, when the company is unknown outside its own HQ-location and has no overseas staff or route-to-market!
This happened back in 2010-2012 and ushered in the downturn of 2012-2014, and was accompanied by the reality of a European market that was not ready to grow by a factor of 10 overnight! The difference today is only in the numbers, except for the fact that it is a China-inflicted problem that will impact first on its domestic companies, and then have its secondary ripple globally.
Before any tinkering has to happen with policy and deployment of PV in China, it needs one major action to happen first: turn-off-the-credit-lines, and instruct the companies not to build any more factories until they are allowed to. Without this, it matters not what they do with policy, because it is runaway investments, and not local demand, that is the real problem.
Having efficiency targets to weed out the technology laggards doesn’t do the trick. Ordering firms to show >1% of revenues going into the R&D-spending box during accounting is also not a route to removing the also-rans (or actually being innovative!).
Stopping the credit lines for new factories has to be the top priority. Then see what the lay of the land is, and adjust expectations on deployment (policy) to prevent an excess of factories to slow down or be shut down. In the meantime, perhaps the time has come to finally draw up that mysterious list of who the top-10 government-favoured manufacturers in China really are, and work out how much of the capacity residing with the other 200 companies should be folded into each of these top-10 producers. (Like what South Korea and Taiwan did in other sectors over the past few decades, but in the totally opposite way!)
It is almost unimaginable that China will leave its manufacturing segment to shut-down, and this may cushion the impact, while they convince the government that they are getting their act together collectively.
So in contrast to much of the sensationalist output coming from other media outlets in the past few weeks, the sky is not going to fall in on China’s PV manufacturing segment overnight, and the industry will continue to grow globally, have lower production costs and increased panel efficiencies and performance levels.
I conclude the discussion now in hope that the next shakeout of manufacturing will be one driven by technology, and not merely by the ability of one country to access endless cash to add me-too production lines. This may be closer than we think, especially if wafers move to 120 microns as standard, or n-type finally takes chunks out of p-type dominance. Commenting on this type of activity will be far more stimulating for sure!


")