The ‘2020 PV Module Reliability Scorecard’ report, undertaken each year by PV Evolution Labs (PVEL) in partnership with DNV GL, has continued to raise questions over key aspects of module reliability.
This is not just because of the accelerated development and introduction of new modules that drive the LCOE (levelised cost of electricity) down but because well-known and proven reliability testing sequences still catch out products that fail to meet the required degradation rates of less than 2% to become a recognised ‘Top Performer'.
Granted, PVEL’s testing sequence criteria has evolved over the years, primarily to increase cycle-times that further pushed the ability of modules to meet the Top Performer requirements as part of the lessons learnt during the evolution in module reliability testing.
Try Premium for just $1
- Full premium access for the first month at only $1
- Converts to an annual rate after 30 days unless cancelled
- Cancel anytime during the trial period
Premium Benefits
- Expert industry analysis and interviews
- Digital access to PV Tech Power journal
- Exclusive event discounts
Or get the full Premium subscription right away
Or continue reading this article for free
A good example of this would be the PVEL Damp Heat (DH) test, where it has become well known that under the IEC 61215 electrical safety test, a DH duration of only 1,000 hours is required, which led to relatively few modules experiencing electrical safety issues regardless of the Bill of Materials (BOM) used meeting IEC test conditions.
However, PVEL doubles the number of cycles to 2,000, which has proven to uncover a number of degradation issues that reduce module performance well past the 2% PVEL degradation rule. As such the DH test remains a benchmark for module reliability as the number of BOM variations continue to increase in the pursuit of lower LCOE metrics.
Importantly, in the 2020 report, PVEL has also added a boron-oxygen (BO) stabilisation step to the tough damp heat testing regime as the test’s high temperature and no current environment can also lead to destabilisation of the passivated BO complexes within some PERC cells, according to PVEL. To further explore this problem, PVEL added a post-DH2000 boron-oxygen stabilisation process to its PQP (Product Qualification Program) sequence.
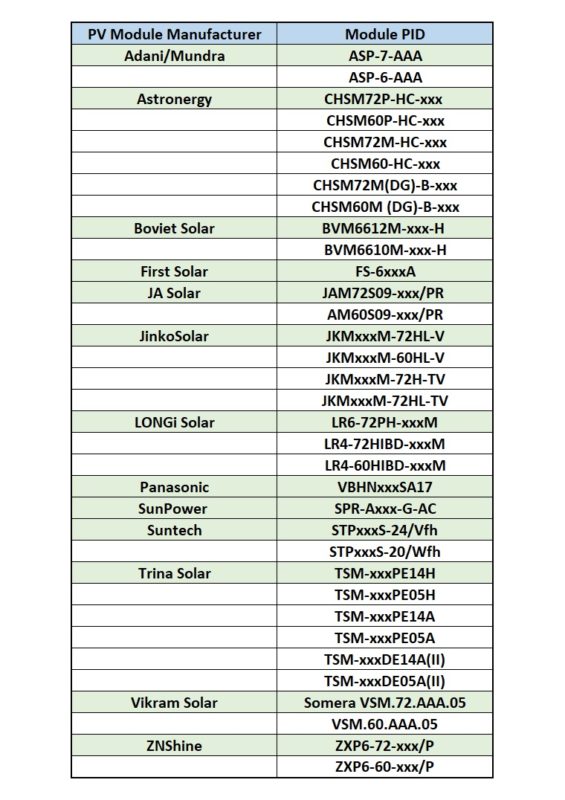
The more recent introduction of Potential Induced Degradation (PID) testing is another development in line with the mass introduction of Passivated Emitter Rear Cell (PERC) technology that can suffer this type of performance degradation, undermining the performance benefits of the cell technology and therefore the claimed lower LCOE.
Although PVEL is also introducing a Light and Elevated Temperature Induced Degradation (LeTID) test, this was only announced in mid-2019 and so more time is required for this new test to be introduced, primarily for mono-PERC cells. As a result, the LeTID susceptibility test highlighting Top Performers did not appear in the current report. This was also true for the new backsheet durability sequence.
In keeping with previous analysis of PVEL’s report we will first look at the four historical reliability tests and the developments noted in the latest report.
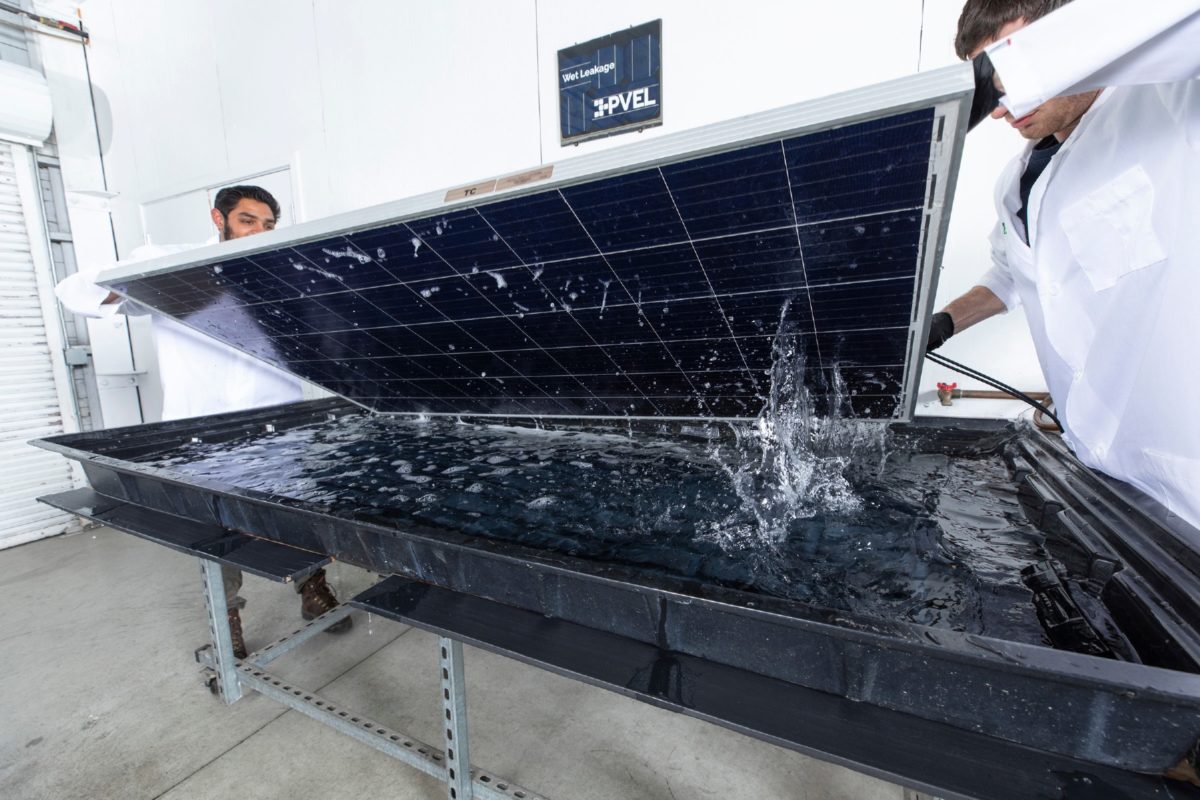
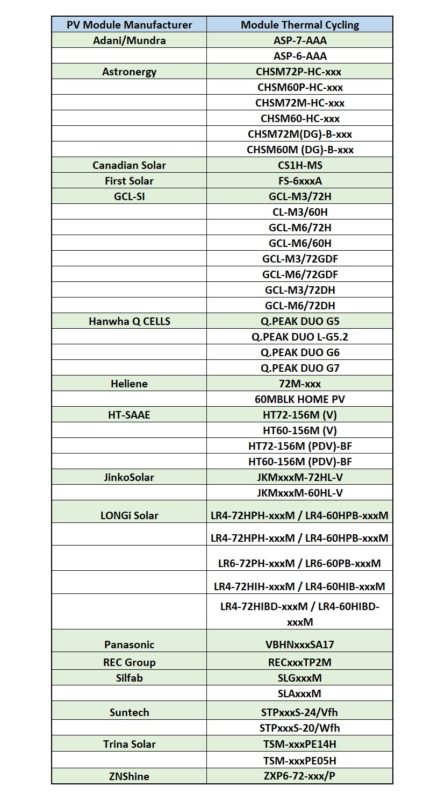
Thermal cycling
In PVEL’s thermal cycling test sequence, modules are placed in an environmental chamber where the temperature is lowered to -40°C, dwelled, then increased to 85°C and dwelled again. Maximum power current is applied to the modules while the temperature is increased and decreased.
A total of 600 cycles, repeated 200 times over three periods is said to equate to about 84 days in the climate chamber. However, PVEL previously ran the TC test with 600 cycles but had increased this to 800 cycles in recent years. DNV GL had noted in the PV Tech-hosted TechTalk webinar and in the report that the lowered number of cycles was due to its analysis that the TC600 test was actually a sufficient test duration with few reliability excursions being meaningful or could introduce non-representative failure mechanisms when undertaking the extended test. It should be noted that IEC 61215 testing requires only 200 cycles, which has proven insufficient.
PVEL had previously noted that thermal cycling performance improved 42% in the 2019 scorecard, even though it used TC800 sequence.
In the 2020 report, PVEL noted strong results from a host of wafer, cell and module varieties such as standard and half-cut cell module types, as well as thin film, shingled cells, multi-bus bar and heterojunction (HJT) modules.
There were nine PV module manufacturers that achieved Top Performer status in the thermal cycling tests in 2019, compared to 17 manufacturers in the 2020 TC tests.
It should be noted that both glass-glass and glass-backsheet bifacial modules achieved Top Performer status in the 2020 TC tests and that a total of 54 different modules were recognised as Top Performers. In 2019 the number of Top Performer modules was 24.
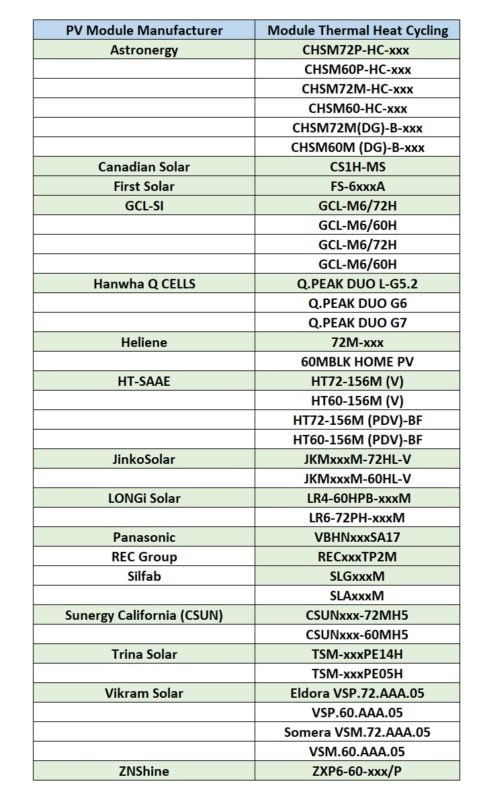
Damp heat
In PVEL’s damp heat tests, PV modules are placed in an environmental chamber and held at a constant temperature of 85°C and 85% relative humidity for 2,000 hours (about 84 days in total). The heat and moisture ingress stress the layers of the PV module. In comparison, IEC testing has a duration of only 1,000 hours.
There were six Top Performers in the 2019 damp heat tests, compared to 13 in the 2020 scorecard, a significant increase from previous years.
PVEL noted that this was mainly due to newer bifacial glass-glass and glass-backsheet module BOM shifting from EVA to POE in glass-glass modules, having performed poorly in previous DH tests. A significant number of tested modules in 2018 and 2019 had exhibited greater than 4% degradation, according to previous PVEL reports.
As a result, the number of different modules achieving Top Performer status also increased to 32 in the 2020 scorecard, compared to 16 in the 2019 report.
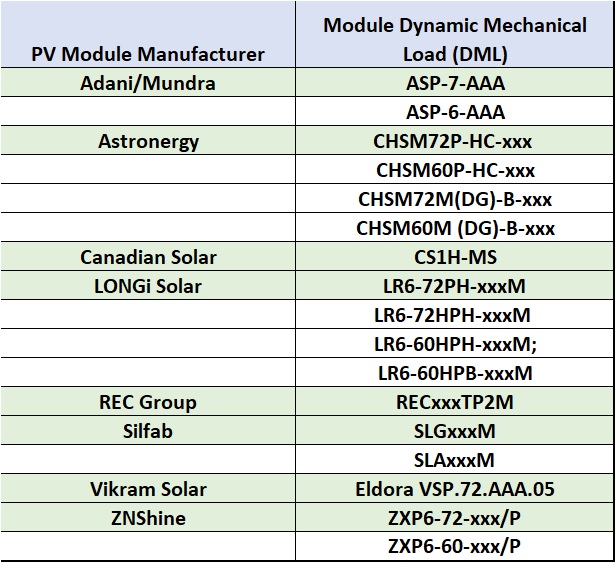
Dynamic mechanical load
In the DML testing, PVEL installs a module according to the manufacturers’ recommended mounting configuration, then subjected to 1,000 cycles of alternating loading at 1,000 Pa. The module is then placed in an environmental chamber and subjected to 50 thermal cycles (-40°C to 85°C) to cause microcrack propagation, then three sets of 10 humidity freeze cycles (85°C temperature and 85% relative humidity for 20 hours followed by a rapid decrease to -40°C) is used to stimulate potential corrosion.
The modules are then characterized and inspected visually to evaluate the status of the module’s frame, edge seal and cell interconnections. The dynamic mechanical loading can induce microcracks that do not necessarily result in significant power loss, according to PVEL, yet only after thermal cycling and humidity freeze testing that metal conductors affected by cell cracks can break, which leads to black inactive areas and increased power degradation.
DML testing sequence had been tweaked in the 2019 Scorecard to include 30 humidity freeze cycles. About 80% of the historical test data included only 10 humidity freeze cycles, according to PVEL.
As a result, the percentage of dynamic mechanical load sequence Top performers fell by 37% in the 2019 results, versus historical results, according to PVEL. There had been nine PV module manufacturers that had achieved Top Performer status in the 2019 DML tests.
However, in the 2020 scorecard that number declined to eight, proving the DML test is proving much more difficult to achieve year-on-year. PVEL put this down to several reasons, including BO destabilisation in PERC cells because of the damp heat conditions during humidity freeze testing.
PVEL also noted that module performance was susceptibility to power loss caused by cell cracking and rapid temperature changes, as part of the new mechanical stress sequence (MSS). PVEL plans to release a separate publication featuring MSS results in the coming months. PVEL also reported that both glass-glass and glass-backsheet bifacial modules had shown similar performance results following the DML sequence.
A total of 16 different modules had achieved DML Top Performer status in the 2019 scorecard, compared to 19 in the 2020 report.
Potential-Induced Degradation
PVEL’s PID test is carried out in an environmental chamber with voltage bias equal to the maximum system voltage (MSV) rating of the module (-1000 V or -1500V) being applied under 85°C and 85% relative humidity for two cycles of 96 hours. These temperature, moisture, and voltage bias conditions allow PVEL to evaluate degradation related to increased leakage currents.
Results from the 2019 Scorecard showed 15 PV module manufacturers have PID under control, which was lower than the 20 companies achieving Top Performer status in the 2018 test report.
The number of PID Top Performers in the 2020 report stood at 20 out of 22 companies reported to have been in the tests that received at least one Top Performer award from the four historical reliability testing regimes. .
Importantly, a total of 47 different modules achieved Top Performer status in the PID tests in 2020 scorecard, compared to 34 different modules in the 2019 report.
However, PVEL noted in the latest report that the median PID degradation results had been higher than at any time in its ten years of testing.
In reference to PID testing of bifacial modules, PVEL noted that there was both a wide range of front-side and rear-side cell degradation, with bias towards higher degradation on the rear side cell. In one case, PVEL reported power loss of over 30%.
Some of the rear side degradation was said to be due to a reversible polarization effect that could occur in bifacial modules during PID testing, but not all p-type bifacial modules suffered this issue.
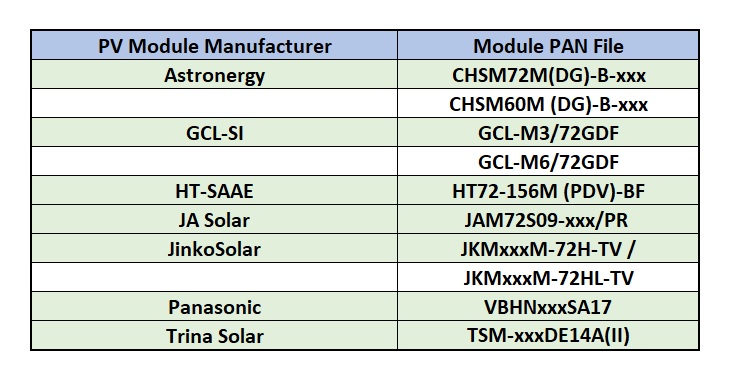
PAN files
New to the Top Performer rankings test is PAN files. This is analysis PVEL has used in its PQP work but is the first time included in benchmarking module energy yields with PVsyst software.
The procedure is to have three identical PV modules tested across a matrix of operating conditions per IEC 61853-1, ranging in irradiance from 100 W/m2 to 1100 W/m2 and ranging in temperature from 15°C to 75°C. Two 1MW PV plant site simulations are undertaken with one site in a temperate climate at a 0° tilt (in Boston, USA), and a 1 MW site in a desert climate at 20° tilt (in Las Vegas, USA). A custom PAN file is then created with PVsyst’s modelling software that enable PVEL to measure the highest kWh/kWp energy generation based on PVEL’s measurements such as temperature losses and low-light conditions.
PVEL noted that its historical PAN file data from all PQPs since 2016, meant that only 4% of modules tested would receive a 2020 Scorecard Top Performer designation.
There are a lot of moving parts in this testing, not least in relation to bifacial modules. The lack of real world data on operating bifacial plus tracker PV power plants has challenged PVsyst modelling accuracy, especially in low-light conditions, according to presentations at the last BiFi workshop in Amsterdam, in September 2019.
PVEL noted that that bifacial modules showed a step-function performance improvement as two thirds of the Top Performers were bifacial modules. The exclusion of inverter clipping at the simulated PV power plant in Las Vegas led to mono-bifacial modules generating 7.7% higher median output higher than monofacial modules. At the simulated horizontal tilt site in Boston the median bifacial energy yield was 3.3% higher than the monofacial median.
Other differentiated yield performances simulated included a heterojunction module, which obviously offered high temperature performance gains, due to having some of the lowest temperature coefficients.
It should be noted that the data presented below is only from PVEL’s PAN testing as part of a PQP where the samples are factory witnessed.
As a result, there were seven 7 PV module manufacturers that achieved Top Performer recognition in the first PAN file test, which included 10 different modules.
PVEL’s 2020 Top Performers
We should make it clear that in compiling PVEL's 2020 Top Performer rankings analysis from the historical four key module reliability testing regimes, PVEL has reiterated that not all PV module manufacturers undertaking the scorecard are required to make public the testing results.
Also, it is important to clarify that several PV module manufacturers that achieved Top Performer ratings in some categories, were listed in the 2020 report, yet PVEL had not completed full tests on some of these manufacturer’s modules at the time of the reports publication, which could include some manufacturer’s modules only achieving a few Top Performer rankings but when full testing is completed could have achieved more higher Top Performer rankings.
The chart below is a compilation of the 22 PV module manufacturers that successfully achieved Top Performer status for any number of modules tested in any of the historical module reliability testing regimes in the 2020 Module Reliability Scorecard that have been made public but may also have not completed all test when PVEL published the report.
Basically, this chart is just the total number of Top Performer rankings a company achieved in the 2020 scorecard, regardless of the number of modules entered the testing by any given module manufacturer.

However, the table below also ranks manufacturers by the total number of Top Performer awards, but also breaks out the number of different modules tested from these manufacturers that contributed to each manufacturers total.

We can note that the first two manufacturers listed, Astroenergy and LONGi Solar achieved the highest number of Top Performer awards with a contrasting number of modules tested.
However, further down the rankings PV manufacturers Top Performer awards coupled to the number of different modules receiving awards is more uniform. This indicates that some companies are outperforming others from the perspective of having achieved Top Performer status in all four historic testing regimes, sometimes for just one module but also for several different modules.
One example of a PV manufacturer achieving Top Performer status in all four historic testing regimes with only one module is REC Group. An example of a PV manufacturer achieving Top Performer status in all four historic testing regimes with more than one module is Silfab.
Although this is hard to detect in the above combined table, breaking out all the PV manufacturers that achieved Top Performer status in all four historic testing regimes, regardless of the number of different modules tested provides the elite group (see table below) of Top Performers from the 2020 scorecard.
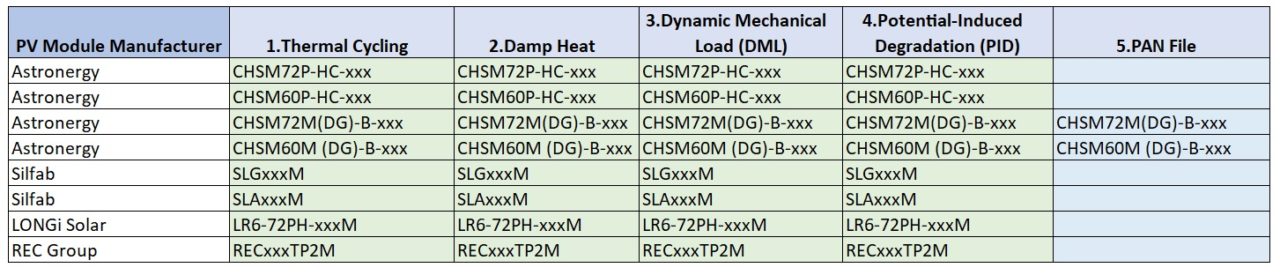
As noted previously, REC Group is represented in this elite group with its monocrystalline PERC-cell based ‘TWIN PEAKS 2’ module, in case people are not that familiar with their module part numbering system.
LONGi Solar’s HiMO 1 module, which is a mono PERC based module, is also listed as it achieved Top Performer status in all four historic testing regimes.
North American based PV manufacturer, Silfab punched well above its manufacturing weight (capacity) with two mono PERC-based modules achieving Top Performer status in all four historic testing regimes.
Finally, we have China-based Astronergy that had four modules out of six different product offerings receive Top Performer status in all four historic testing regimes. These elite Top Performer modules include Astronergy’s Astro Twins half-cut mono PERC, half module designed product offering.
The company was also amongst the few manufacturers to achieve Top Performer status in the new PAN file performance analysis. As such, Astronergy has set the bar very high for next year.
Indeed, PVEL indicated that in the 2020 scorecard testing, several tests, notably DML may have been the toughest test to achieve Top Performer status but there were a number of PV manufacturers modules that were very close to the 2% deviation rule. Therefore, the number of manufacturers with a clean sweep of the historical testing regimes could have been much higher than in previous years.
That said, the 2021 scorecard should include the planned new testing categories and so in many respects will be a new class of Top Performers from that point onwards.
The PV Module Reliability Scorecard, now in its 6th edition, ranks commercially available PV modules by their performance in PV Evolution Labs’ Product Qualification Program (PQP), a comprehensive, rigorous test regime that assesses reliability and performance of PV modules. The 2020 rankings will be released on live webinars.
Tristan Erion-Lorico, head of PV module business at PV Evolution Labs (PVEL), will share this year’s top-performing PV modules and discuss key findings from PVEL’s PQP testing, with a special focus on the performance of bifacial PV modules. He will be joined by Dr. Dana Olson, global solar segment leader at DNV GL. Dr. Olson will offer an analysis of trends in PV module quality and discuss how PVEL’s test data is used by DNV GL as part of a module useful life analysis. Mark Osborne of PV Tech will also join the webinar to cover his top highlights from the 2020 Scorecard as compared to the previous editions.
To register for the free to attend ‘PV Tech TechTalk' webinar, entitled “Top-Performing PV Modules: The 2020 PV Module Reliability Scorecard”, click here.
Webinar timings – local time zones
Webinar 2 –
San Francisco (UTC -7): 5/28 at 09:00
New York (UTC -4): 5/28 at 12:00
London (UTC +1): 5/28 at 17:00
Munich (UTC +2): 5/28 at 18:00
Singapore (UTC+8): 5/28 at 24:00


")
