Australia’s utility-scale solar PV and wind assets generated a combined 4.73TWh in June 2026, an 11% increase from 4.25TWh in June 2025, according to Rystad Energy senior analyst David Dixon.
The result extends a run of year-on-year growth in combined utility-scale output that has persisted throughout 2026.
Try Premium for just $1
- Full premium access for the first month at only $1
- Converts to an annual rate after 30 days unless cancelled
- Cancel anytime during the trial period
Premium Benefits
- Expert industry analysis and interviews
- Digital access to PV Tech Power journal
- Exclusive event discounts
Or get the full Premium subscription right away
Or continue reading this article for free
As PV Tech reported for May 2026, the fleet generated 4.6TWh that month, up 10% from May 2025. April delivered 4.7TWh, a 24% year-on-year increase and March also reached 4.7TWh.
The year-to-date peak remains February’s 5TWh, driven by strong summer solar irradiance across multiple states.
Victoria led all states in June for combined utility solar and wind output at 1,369GWh, comprising 114GWh from utility solar PV and 1,255GWh from wind.
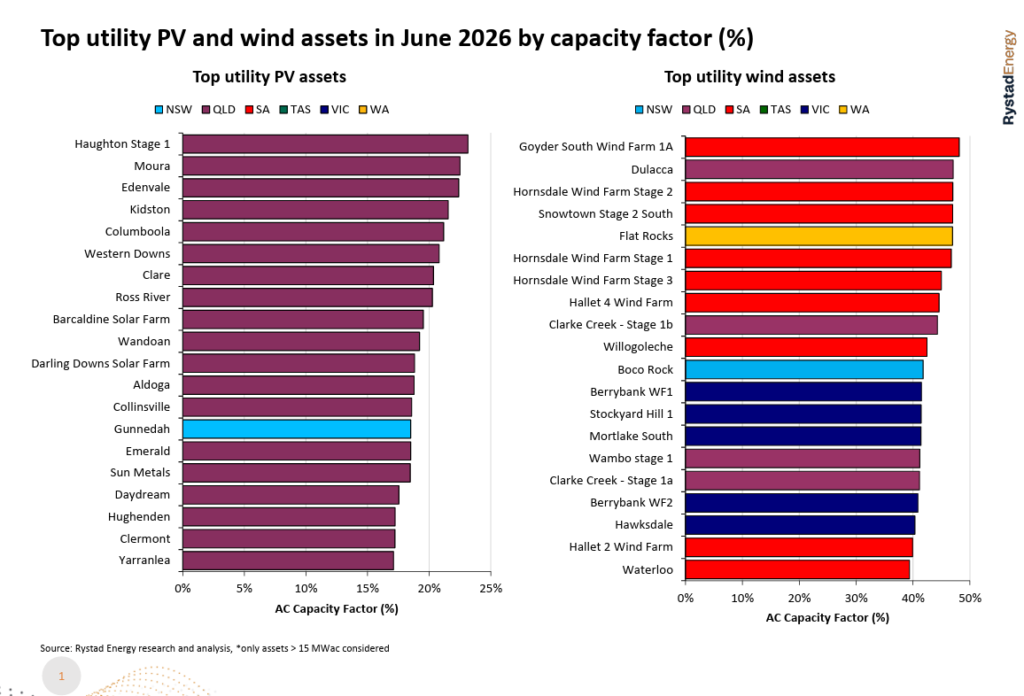
For utility solar PV, the top performers were all in Queensland, where winter irradiance conditions favour lower-latitude assets.
Pacific Blue Australia’s 100MW Haughton Stage 1 led with an AC capacity factor of 23.1%, ahead of METKA’s Moura at 22.5% and the Sojitz/ENEOS Group Edenvale project at 22.4%.
Of the top 20 utility PV assets ranked by capacity factor in June, 19 were in Queensland, with the sole exception being the Gunnedah Solar Farm in New South Wales.
The dominance of Queensland in the winter solar rankings reflects both the state’s lower latitude and the concentration of recent large-scale project commissioning in the state’s Central West and Darling Downs regions.
A construction milestone and a demand shift
The most forward-looking data point in June’s figures is on the construction side. June 2026 marked the first time Australia has surpassed 3GWdc of utility-scale solar construction starts in a single calendar year, with more than six months still remaining.
Lightsource bp broke ground on the 380MWdc Lower Wonga solar-plus-storage project in Queensland during the month, pushing the year-to-date total past the milestone.
Dixon noted that approximately 43% of the 3GWdc started in 2026 so far, around 1.3GWdc, is at remote mine sites, highlighting the growing appetite for behind-the-meter renewable energy generation in the resources sector alongside the grid-connected pipeline.
The Capacity Investment Scheme (CIS) Tender 8 results were also announced during June, with the federal government awarding contracts to 15 battery storage projects totalling 4.2GW and 16.1GWh across the National Electricity Market (NEM).
Queensland received the largest single-state allocation and Ampyr Energy secured four of the fifteen contracts, reinforcing the state’s position as the primary destination for both solar construction and new storage procurement in the current investment cycle.
Spot electricity prices remained low across most of the NEM during June, with all states except South Australia recording spot prices below AU$90/MWh (US$62/MWh).
South Australia’s monthly average was pushed above AU$125/MWh by a period of low wind generation toward the end of the month, though the state set a June wind generation record overall.
Average operational demand across every hour of the day in June 2026 was materially lower than in June 2025, with peak evening demand in NSW reaching around 10GW compared to over 11GW in the same month last year.
Dixon attributed the reduction primarily to warmer-than-typical winter weather, which reduced heating demand, though the scale of the shift across both morning and evening peaks also reflects the cumulative effect of rooftop solar self-consumption, improved building energy efficiency, and the growing household battery fleet absorbing load that would otherwise appear as grid demand.


