Australia’s utility-scale solar PV and wind assets generated a combined 4.7TWh in April 2026, up 24% from 3.8TWh in the same month last year, according to data from Rystad Energy.
The year-on-year increase follows March’s more modest 2% growth year-on-year, which saw combined generation reach 4.7TWh, reflecting improved wind conditions across the National Electricity Market (NEM) and continued capacity additions.
Try Premium for just $1
- Full premium access for the first month at only $1
- Converts to an annual rate after 30 days unless cancelled
- Cancel anytime during the trial period
Premium Benefits
- Expert industry analysis and interviews
- Digital access to PV Tech Power journal
- Exclusive event discounts
Or get the full Premium subscription right away
Or continue reading this article for free
The April figures reveal a continued geographic concentration in performance, with Queensland and New South Wales dominating the utility solar rankings, while Queensland and Tasmania emerged as the standout performers for wind generation.
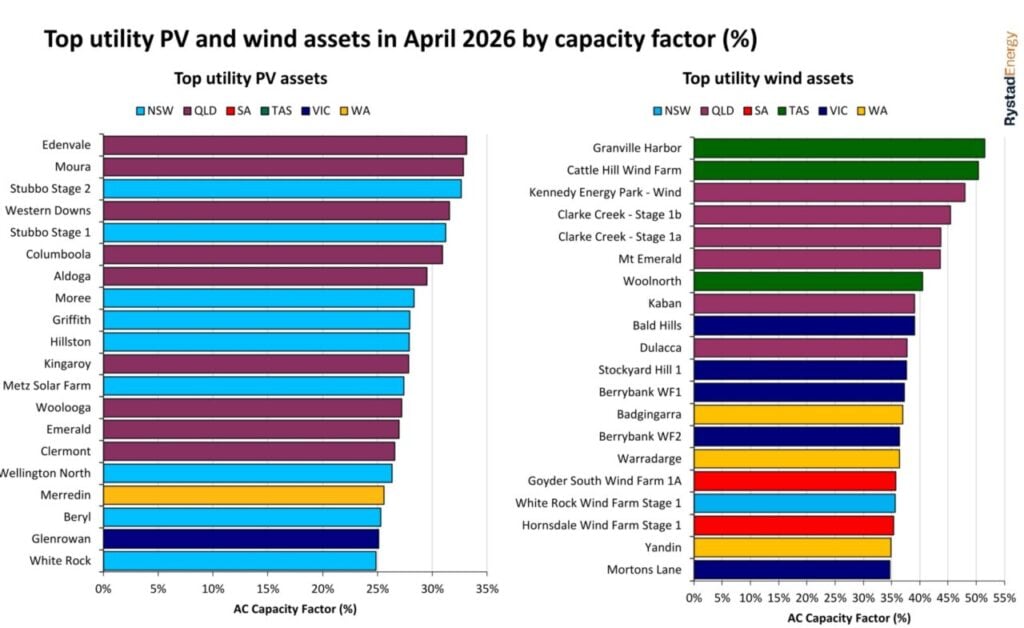
For utility-scale solar PV, the top five best-performing assets, in terms of AC capacity factor, were concentrated entirely in Queensland and New South Wales. ENEOS Group and Sojitz Corporation’s 204MW Edenvale Solar Park led the rankings with an AC capacity factor of 33.1%, followed by METKA’s 110MW Moura Solar Farm at 32.8% and ACEN Australia’s 400MW Stubbo Stage 2 at 32.6%.
These capacity factors represent a modest improvement from March’s leaders, when Hana Financial Investment’s Columboola solar PV power plant achieved an AC capacity factor of 32.4%, reflecting the seasonal transition into autumn.
Queensland emerged as the standout state for combined utility solar and wind generation, delivering 1,256GWh comprising 678GWh from utility PV and 578GWh from wind. The state’s wind generation also jumped 112% year-on-year, reaching 578GWh in April 2026, up from 273GWh in April 2025.
The top-performing wind assets were all located in Queensland and Tasmania. Atmos Renewables and Palisade Investment Partners’ Granville Harbour Wind Farm led at 51.5% capacity factor, followed by Atmos Renewables’ Cattle Hill at 50.4% and Eurus Energy Holdings’ Kennedy Energy wind farm at 48%.
NEM wind generation reached 2.76TWh in April, up 33% from 2.08TWh in the same month last year, with wind generation increasing year-on-year across all NEM states.
Gas generation hits two-decade low
Beyond generation performance, April witnessed several developments signalling the accelerating transformation of Australia’s electricity sector.
NEM gas generation fell to 382GWh in April, down 49% from 745GWh in April 2025, marking the lowest monthly gas generation in over two decades as battery storage continues to displace gas during evening peak periods.
Queensland recorded a milestone in utility-scale battery storage, becoming the first NEM state to discharge over 100GWh in a single month. The performance reflects the growing role of battery storage in managing grid stability as the market transitions away from thermal generation.
NEM intraday spreads have collapsed as battery capacity ramps up. The average two-hour intraday spread was less than AU$110 (US$78.85) per MWh across all states except South Australia, which recorded AU$154 per MWh. However, April is typically a low-demand period in the Australian energy calendar.
Two battery projects commenced construction during the month: Alinta Energy’s 250MW/1GWh Reeves Plains battery in South Australia, which will be the state’s largest, and Hanwha Energy’s 100MW/200MWh Tangkam battery storage system in New South Wales.
Geoff Eldridge of consultancy Global Power Energy estimates that approximately 571GWh of renewable energy generation was curtailed across the NEM in April, comprising 316GWh of wind and 255GWh of solar.
Around 459GWh was curtailed during negative-price intervals, and 112GWh during positive-price intervals.
Victoria recorded the highest curtailment at 255GWh, followed by New South Wales at 122GWh, South Australia at 100GWh and Queensland at 95GWh. Tasmania recorded negligible curtailment.
The curtailment figures underscore the challenge facing Australia’s renewable energy sector as generation capacity continues to outpace grid infrastructure development. Utility-scale solar and wind curtailment exceeded 7TWh across the NEM in 2025, underscoring the need for additional transmission capacity and energy storage to capture otherwise wasted renewable energy.


