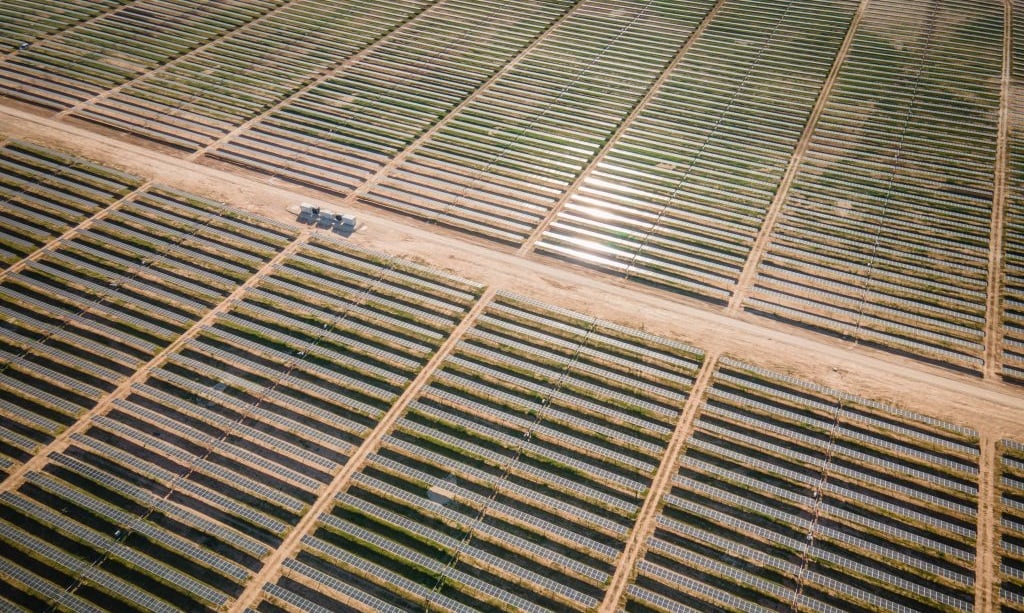
The levelised cost of electricity (LCOE) generated from solar power could fall by as much as 55% globally by 2030 as technology and production costs decline, new research from energy major bp has revealed.
A rapid projected expansion of solar is underpinned by continuing falls in costs and supported by increasing module efficiency and larger projects scales, bp said in its latest Energy Outlook report, which provides a guide as to how the global energy system may evolve over the next 30 years.
Try Premium for just $1
- Full premium access for the first month at only $1
- Converts to an annual rate after 30 days unless cancelled
- Cancel anytime during the trial period
Premium Benefits
- Expert industry analysis and interviews
- Digital access to PV Tech Power journal
- Exclusive event discounts
Or get the full Premium subscription right away
Or continue reading this article for free
The LCOE of solar, including integration costs, falls by 40 – 55% by 2030 across the three scenarios included in the report. The global average LCOE for utility-scale PV in the first half of 2021 was US$48/MWh, according to research organisation BloombergNEF.
bp said the pace of cost reductions slows and eventually plateaus in the final two decades of its outlook as falling costs of generation are offset by the growing expense of balancing power systems with increasing shares of variable power sources.
The declining role for fossil fuels is offset by the rapid expansion of solar and wind, with the share of renewables in global primary energy increasing from around 10% in 2019 to 35 – 65% by 2050 in the three scenarios.
Supported by increasing electrification, combined installed solar and wind capacity by 2050 increases more than 15-fold from 2019 levels in bp’s accelerated and net zero scenarios and by nine-fold in the new momentum path.
Emerging economies would account for more than three-quarters of the increased deployment of solar and wind capacity in the accelerated and net zero scenarios by 2050, with China contributing around a quarter of the increase.
By 2050, the net zero path forecasts that there would be almost 21TW of deployed solar and wind capacity. That figure is slightly lower than the 22.7TW of solar and wind that the International Energy Agency projected would be deployed globally by 2050 in its net zero scenario included in its latest World Energy Outlook report, published in October.
bp’s rapid acceleration in solar and wind installs is dependent on a range of enabling factors scaling at a similar rate, including transmission and distribution capacity, availability of key materials, planning and permitting, and social acceptability.
In addition, the growth in solar and wind requires a substantial increase in the pace of investment in both new capacity and enabling technologies and infrastructure.
The report said that although government ambitions globally have grown markedly in the past few years, pointing to new, increased momentum in tackling climate change, there is “significant uncertainty” as to how successful countries and regions will be in achieving those aims and pledges.


