Following on from the successful year for solar that was 2016, the US market added 2,044MW of new capacity in Q1 2017 alone. As installations grow, prices continue to fall to new lows and utility-scale system prices dropped below US$1/Watt for the first time according to GTM Research.
Q1 was the sixth straight quarter in which more than 2GW of solar PV and more than 1GW of utility-scale PV was installed. Solar accounted for 30% of all new electric generating capacity installed in Q1 2017, ranking as the second-largest driver of capacity across all fuel types.
Unlock unlimited access for 12 whole months of distinctive global analysis
Photovoltaics International is now included.
- Regular insight and analysis of the industry’s biggest developments
- In-depth interviews with the industry’s leading figures
- Unlimited digital access to the PV Tech Power journal catalogue
- Unlimited digital access to the Photovoltaics International journal catalogue
- Access to more than 1,000 technical papers
- Discounts on Solar Media’s portfolio of events, in-person and virtual
GTM’s latest market update report also revealed that the residential and non-residential PV markets are both expected to experience year-over-year growth, even as the quarterly numbers saw a drop from last year’s record-setting pace.
“The solar market clearly remains on a strong upward trajectory,” said Abigail Ross Hopper, SEIA’s president and CEO. “Solar is delivering more clean energy, adding jobs 17 times faster than the US economy and creating tens of billions of dollars in investment. With its cost-competitiveness, we know solar will continue to play a growing role in America’s energy portfolio.”
Altogether, the overall U.S. solar market is expected to drop 16% on an annual basis as utility PV projects decline relative to the massive utility PV pipeline build-out witnessed in 2016.

Utility-scale
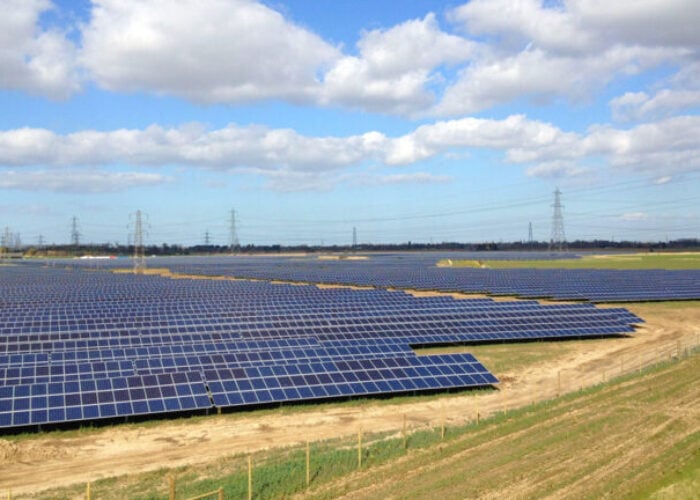
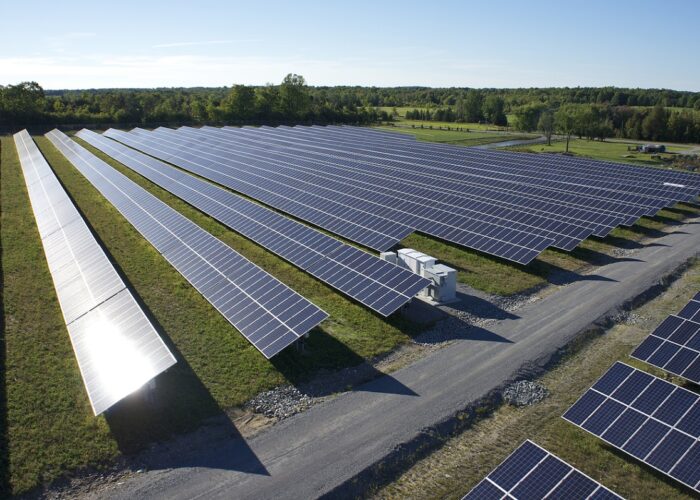
The utility-scale segment continues to lead the market, representing more than half of all PV installations made in Q1. This is mainly due to the residual push from the investment tax credit (ITC) extension, which resulted in many projects slated for 2016 completion being pushed back. GTM predicts that the entire year is expected to benefit from those ‘spill-over’ projects.
Overall, 1,082 MW of utility-scale solar was installed in Q1 2017.
“Utility solar is on the cusp of another boom in procurement,” said Cory Honeyman, GTM Research’s associate director of US solar and report author. “The majority of utility solicitations are focused on maximising the number of projects that can come online with a 30% federal Investment Tax Credit in 2019, or later by leveraging commence construction rules.”
Commercial, industrial and community solar
The non-residential solar market grew 29% year-over-year, but was down 39% from a record high in Q4 2016. A key driver for this is Minnesota’s growing community solar market – which almost doubled in Q1. In addition, growth in this segment was driven by emerging state markets such as Utah, Texas and South Carolina continuing to expand, as well as lesser known solar states such as Idaho and Indiana experiencing large jumps in their installations in Q1 2017.
However, revisions to community solar programme rules, virtual net metering and new solar-friendly rate structures set in 2016 is expected to support incremental growth in 2017 for this segment, through a waning pipeline of projects still being grandfathered under these structures.
Residential
GTM reports for the first time that national residential installations fell both on a quarter-over-quarter and year-over year-basis. 563MW of residential PV was installed in the quarter – down 17% from Q1 2016, and down 11% from Q4 2016. GTM attributes a slowdown in the residential market due to customer acquisition challenges in more mature states like California, as well as several national installers ceasing operations in unprofitable geographies.
According to the report, residential PV installations in California will fall year-over-year for the first time this decade. California’s share of the market dropped to 35% in Q1 – its lowest quarterly share to date. California’s reduced quarterly installation volume is in part due to an unseasonably rainy winter.

The road ahead
GTM forecasts that a whopping 12.6GW of PV will come online before the year end. However, this would still be 16% less than 2016’s solar boom. Total installed US solar PV capacity is expected to nearly triple over the next five years, and by 2022, more than 18GW of solar PV capacity will be installed annually.
But heading into 2018, uncertainty looms over the long-term outlook for US solar if Suniva’s trade petition is successful. The requested minimum import price of 78 cents/Watt could raise system costs between 13-35%, depending on the segment. More than 60% of the current pipeline comes from projects that signed PPAs in 2016 onward, representing 11GW in total. That pipeline is therefore at the risk of project cancellation if module prices end up higher than developers’ assumptions when they initially originated contracts with utilities.
If the petition is approved by the US International Trade Commission (USTIC), then GTM expect to substantially downsize their forecast across all three segments.
However, by 2019, GTM forecasts that US solar is expected to resume year-over-year growth across all market segments. And by 2022, 28 states in the will be 100+ MW annual solar markets, with 25 of those states being home to more than 1GW of operating solar PV.

