Stuti Gupta, Solar Lead at Prescinto, an AI-powered asset performance management platform for solar, wind and energy storage assets, and Prescinto Performance Excellence Head Abhishek Puttanna on the role of artificial intelligence in monitoring and optimising photovoltaic assets.
Need of Advanced O&M Solutions for Managing Solar Assets
Operation and Maintenance (O&M) of Solar (PV) Farms/Plants impacts the industry’s growth and performance levels as a whole. The O&M sector comprises many processes – Technical Asset Management, PV Plant Operation, Plant Maintenance, Data Monitoring, KPI-based plant Performance Tracking, Spare Parts Management, and Revamping & Repowering. Currently, O&M service providers are developing advanced solutions that are more data-driven to meet the market demands, raising the bar for performance enhancements each coming year.
Try Premium for just $1
- Full premium access for the first month at only $1
- Converts to an annual rate after 30 days unless cancelled
- Cancel anytime during the trial period
Premium Benefits
- Expert industry analysis and interviews
- Digital access to PV Tech Power journal
- Exclusive event discounts
Or get the full Premium subscription right away
Or continue reading this article for free
Analysing a plant’s overall performance is typically done using a top-down approach. We first assess the low-performing devices by digging deeper into the project-level, inverters and, finally, the string-level. However, this process is not very time-efficient and mainly depends on subject-matter experts (SMEs) identifying bottlenecks to rectifying underperformance issues faster. In addition, these corrective measures are not exhaustive for the vast sizes of current Renewable Energy portfolios.
Big Data Analytics can bring added value at any stage of O&M objectives: from analysing collected information, fault detection and diagnosis to optimisation via advanced monitoring system recommendations. This report aims to review the usage of Analytics and AI to manage the component-level performance of PV plants in response to the pertinent problems in present-day PV O&M. Among the solutions discussed in this article is the role of AI and Data Analytics in solving these problems, where models are applied to solar plant data to identify performance issues successfully. The highlight of the article is that we detail these approaches applied to investigate and identify the underperformance issues at various levels in the project.
Introduction to Solar PV O&M
One of the key branches in the photovoltaic industry (PV) that have evolved into a key player is Operation and Maintenance (O&M). The quality of O&M services rendered significantly affects PV plants’ long-term reliability, generation and ROI expectancy.
It is universally acknowledged that high-quality O&M services can help reduce potential risks, reduce the levelised cost of electricity (LCOE), and positively impact the investors’ return (ROI). According to the Solar Risk Assessment Report, incorporating 70% corrective maintenance into the annual service fee (fixed rate) of O&M can reduce the overall O&M cost by 28%, which can boost the equity returns by 10%, with typical ROIs for solar assets ranging between 10-15%. Moreover, in today’s highly competitive O&M market, manual albeit standardised practices can be challenging to implement, while advances in the sector’s digitalisation are paving the way for improvements and cost reduction.
Market Dynamics
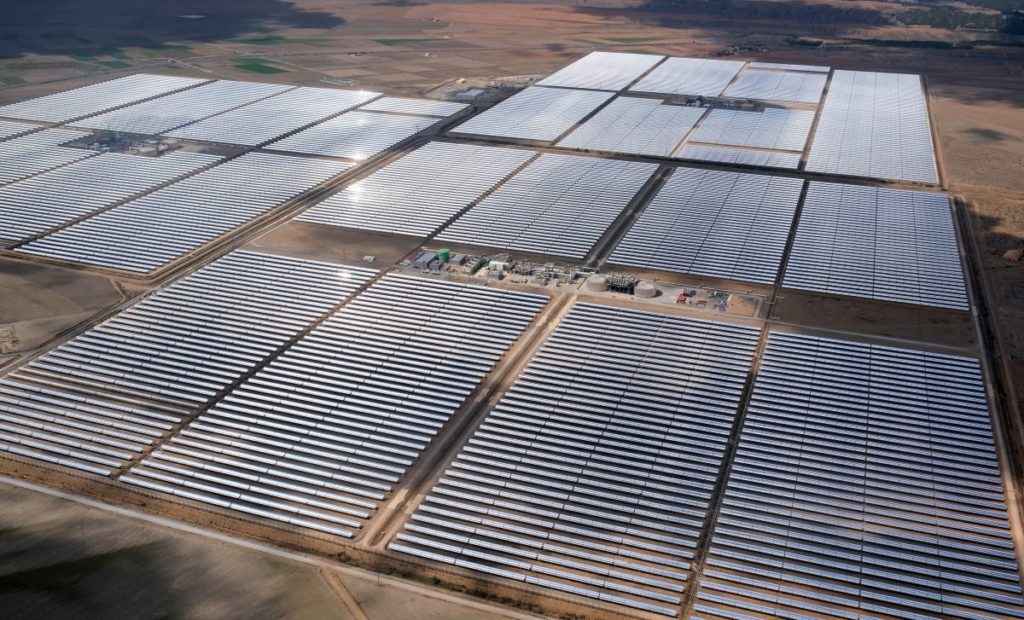
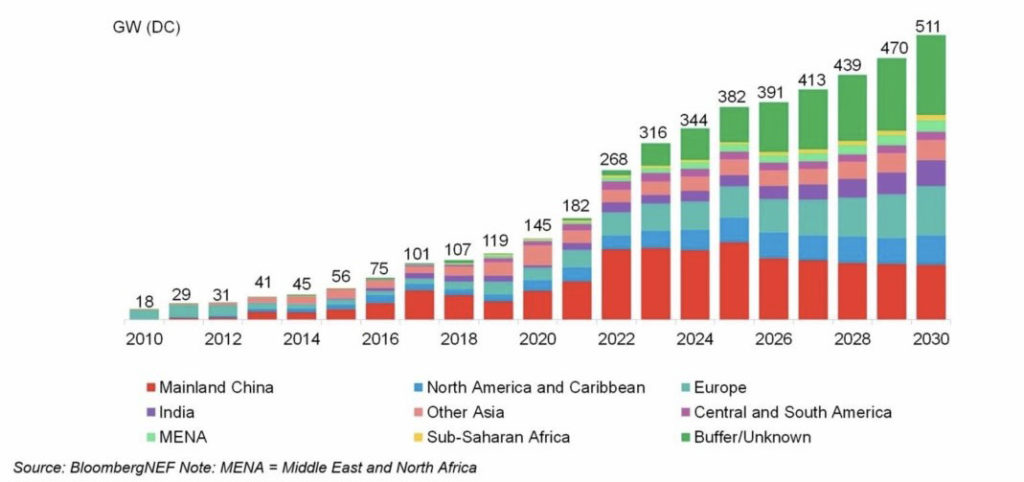
The Bloomberg New Energy Finance (BNEF) report estimated that global solar PV installations will grow at an annual average of 8% from 2021 to 2030. In 2023 alone, 316 GWDC of annual capacity addition is expected, with the utility-scale sector dominating the overall global installed solar capacity (Figure 1). Needless to say, future large-scale installations provide vast opportunities for growth and capital investment in this segment.
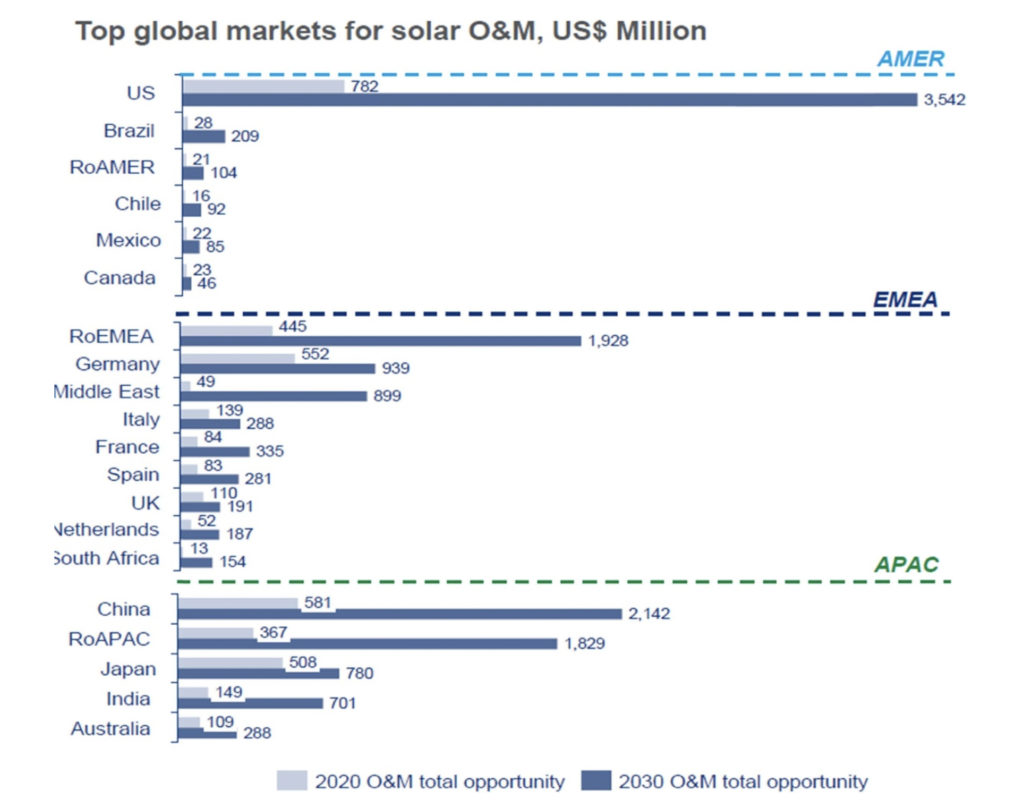
The O&M market is expected to grow at a steady pace of 14%. The Asia-Pacific market is expected to reach nearly US$5.7 billion by 2030, followed by Europe, the Middle East and Africa with US$5.2 billion and North, Central and South America with US$4.1 billion. Of this US$4.1 billion, the US alone will have a significant market share of US$3.5 billion in 2030, making it the largest market (Figure 2). This emphasises that the O&M market segment has a huge potential market to attract investors.
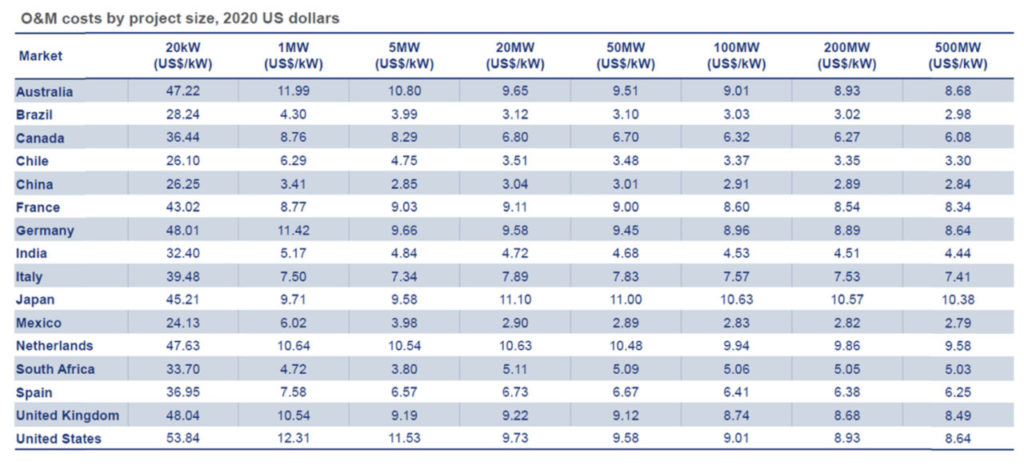
To estimate the competitiveness among O&M providers, an important metric would be the monetary compensation (say, in dollars) per kW. As per the table in Figure 3, the per kW O&M cost undergoes only a marginal change as the project size increases, indicating limited economies of scale. Hence, there is a scope for identifying improvements in the O&M segment to lower the O&M costs and boost the ROI.
Current Best Practices in O&M
Solar Power Europe (SPE) leads and coordinates the development of O&M best practices and is a significant member-led industrial association representing over 260 companies involved in the entire solar value chain. The Lifecycle Quality Workstream also produces the O&M Best Practice Guidelines report, updated and launched every two years. The fifth edition (the most recent from 2021) is based on work that has resulted from the contributions of over 30 solar experts from about 20 global companies, including O&M service providers, asset owners and managers, energy consultants, and technology and digital solutions providers.
This Solar Power Report recommends proper hazard identification, careful planning, regular documented inspections, and maintenance. It also covers personnel and training, technical asset management (TAM), power plant operation, and maintenance. TAM involves supporting activities aimed at ensuring optimal solar power plant operation, including maximising energy production, minimising downtime, and reducing costs. These guidelines are a powerful tool for asset managers to adopt the best practices for the existing installations.
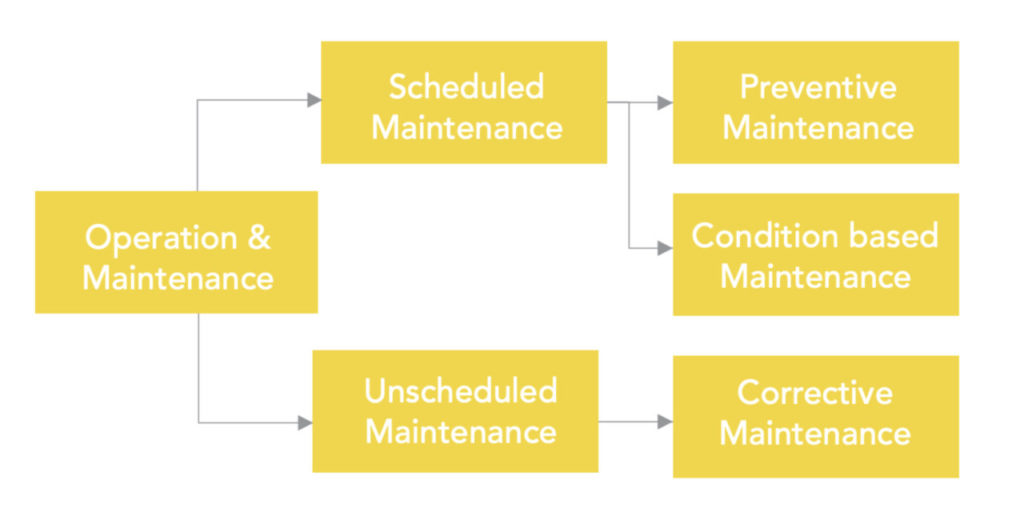
The key focus is O&M optimisation through scheduled maintenance and reducing the losses incurred before corrective maintenance is implemented. Figure 4 explains how maintenance is broadly classified. Scheduled Maintenance (SM), because it is planned in advance and done periodically, can prevent faults from occurring. Some desired practices involve scheduling these tasks in accordance with the manufacturer’s endorsements and conducting them during non-peak hours, preferably during night hours. SM aims to attain an optimum balance between the cost incurred and the increase in the life and yield of the system.
Digitalisation and Innovations in Plant O&M
With the solar industry aiming at achieving an ambitious global scale, the industry has its eyes set on modern technological innovation to drive this growth. These modern-day technologies are gaining steam owing to immense benefits & the returns they promise to offer.
Information Modeling
Solar O&M professionals across the world are aiming to build more efficient processes, reduce costs & risks and drive O&M profitability. Stakeholders across the PV lifecycle are now adopting the BIM (Building Information Modelling) principle to achieve the same.
As reported by the Trust PV Project, BIM, a Data Management Framework, is a proven technique for ensuring the availability of all asset data at the right time and place. The BIM principle closely syncs with digital technologies, implemented across the PV plants’ lifecycle stages. It involves chalking out the processes and components that produce information at different stages. BIM solves the core challenge of information loss as the solar asset switches ownership or project stages. It achieves the same by producing a Single Source of Truth and keeping a dynamic track of all plant components – for example, configuration changes, repowering Initiatives, etc.
Using BIM, an O&M contractor can leverage a central information powerhouse to analyse historical performance and plant metadata, give the right inputs and carry out proactive actions. This can include, for example, analysing key KPIs, contractual obligations, field data & inspections, anomalies & more, thereby producing a future-proof intelligent O&M engine.
Digital Twins
Another innovation that has caught the eye of the industry is the concept of Digital Twins.
As the name suggests, the Digital Twins concept thrives on producing a Virtual Model or a Digital Copy of the solar asset. It creates a simulated environment with all plant configurations, design & structural information replicated, in addition to the performance history of the plant. Furthermore, the virtual twin thus created operates in tandem with the live plant and receives the latter’s status, performance & health data throughout the lifecycle. In contrast to traditional software, a Digital Twin factors in the precise environmental, geographical & locational information, thereby ensuring accurate plant replica creation for more detailed experiments.
An ideal Digital Twin, once created, centralises plant information and feeds the same into AI/Machine Learning algorithms. These algorithms help process, conceptualise and model the real-world responses of the plant. Furthermore, the live flow of plant sensor data ensures that the algorithm undergoes constant learning and transforms into a self-adaptive intelligence system.
Numerous other innovative mechanisms are also emerging in the evolving solar O&M sector. To quote a few examples, Drone Technologies are becoming a popular choice for thermal inspections of solar sites. O&M professionals are adopting them to achieve an impeccable 70% reduction of cumbersome manual activities. Similarly, Automated Cleaning Processes powered by robotic brushes and wipers are making significant strides. They are replacing traditional water mechanisms and offering the support of Dry Cleaning Robots for areas with severe water shortages.
Last but not least, asset owners are now adopting Digital Solutions as the missing piece of their ever-growing solar asset puzzle. These solutions enable solar professionals to connect the dots between the sensors and plant data to deliver insights for plant generation optimisation. In addition, they’re also introducing the solar industry to AI/ML algorithmic powerhouses to provide value using predictive plant performance analytics.
Big Data Analytics for PV O&M
Data Acquisition
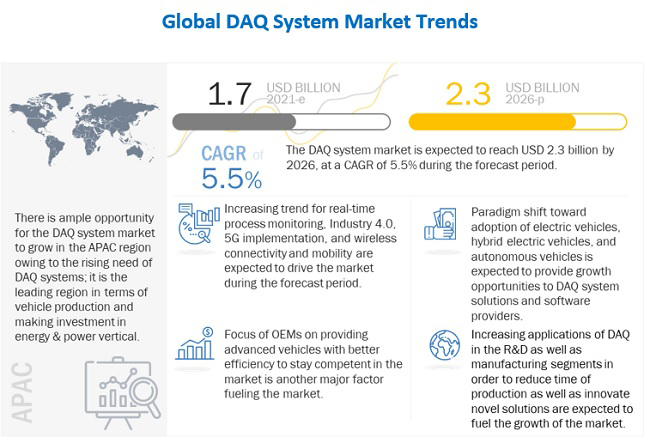
A report by MarketsandMarkets estimates that the DAS (Data Acquisition System) market holds the potential to grow at an impressive CAGR of 5.5% in the coming years till 2026. Therefore, it’s safe to say that as the solar industry grows, DAS systems will continue to achieve stronger adoption for PV monitoring applications.
A Data Acquisition System lies at the core of a PV monitoring system. It helps fetch a wide variety of data from numerous pieces of equipment on the solar farm. Data Acquisition for most plants begins at the sensor-level. Various sensors, such as thermocouples, anemometers, pyranometers, etc., help capture data points such as temperature, humidity and irradiance and more. Once captured, these sensors convert the physical information into electrical signals for further processing. The weak signals generated by sensors are then conditioned to ensure noise isolation and ultimate conversion into a digital signal with the help of an ADC.
The network layer helps connect the different on-ground devices to the plant SCADA for a seamless data flow. It achieves the same using either a Wired Network based on Ethernet/RS-485 Serial Interfaces (with Modbus Protocol) or a Wireless Network designed on Zig-bee, LoRA, Wi-Fi or GSM-based communication. Modern layers may also use Cellular Networks based on NB-IoT/5G communication. The network layer may sometimes include a Data Processing module, popularly designed using Raspberry Pi, Arduino or PLC-based microcontrollers, which helps process the incoming data and pushes the data to the application layer for interfacing & analysis of the equipment performance.
Data Aggregation
A Data Aggregation mechanism is then used to aggregate the data a solar plant and its associated equipment produces, to extract actionable insights and make data-driven decisions for plant optimisations.
However, what makes Data Aggregation a mammoth task, is the sheer volume and, more importantly, the diversity of data a plant produces. Each solar plant houses a wide variety of equipment as its core components. These include panels, inverters, meters, relays, transformers, weather stations, and more. As essential as they are for seamless operation, the pieces of equipment generate data in different formats at different frequencies. All this information may even reside at different locations and in different time zones, introducing time-series irregularities – these differences create data inaccuracies, errors and raise security concerns. In addition, they further induce data quality concerns such as junk values, outliers, false positives and more. The granularity/frequency of data generation (1-min, 5-min, 15-min and even 60-min intervals) makes it furthermore challenging to integrate this data and build a cohesive dataset.
As suggested in the O&M Best Practices report by SolarPower Europe, one of the best ways to tackle Data Aggregation concerns is to have a robust data quality module. Ensuring that the PV monitoring platform has automated data filtering capabilities is critical for an asset owner. Similarly, performing data validation analysis over time spans of 1 to 15 mins helps eradicate time-series irregularities in the plant data. To further streamline Aggregation, there must be an emphasis on transforming data into a normalised/ standardised format that follows standards such as IEC 61724.
Data Monitoring and Performance Analysis
The aggregated data collected from plants should be analysed on the following levels:
• Portfolio/Plant Group Level – Minimum Analysis Requirement
• PV Plant Level – Minimum Analysis Requirement
• PV Inverter Level – Minimum Analysis Requirement
• PV String Level – Recommendation for Insightful Analysis
The monitoring system collects this plant data from various sources. Taking the example of irradiance and radiation data, these are collected by irradiance sensors and pyranometers, respectively. Here, as an industry best practice, having at least 2 pyranometers in the solar plane array, with a data record granularity of at least 15 mins, is recommended for rich data collection. In addition, high-quality satellite data services Solcast/SolarGIS can also be leveraged as data sources here. These are of great help in the event of losing data from faulty sensors as well.
Similarly, the temperature data from the weather monitoring station (WMS), essential to calculate key KPIs like Temperature-corrected Performance Ratio (PR), is also collected. As a best practice, module temperature data should also get recorded at a granularity of at least 15 mins. More sensors may also be required across large plants to capture module temperatures at different representative positions. For example, capturing temperature variations between modules located in the centre and the edge locations of the plant. Apart from temperature data, meteorological data such as wind direction & speed, rainfall, ambient temperature, snowfall, etc., are also acquired from weather monitoring systems, anemometers and shielded thermometers.
In addition to the above, inverter and energy meter data is utilised for calculating performance KPIs. While it is often used for invoicing, energy meter data is the best reference for measuring energy and calculating plant PR and yield.
A typical central inverter project without string monitoring has approximately 300 tags (parameters). Assuming a data frequency of 1 min, the average number of data points received daily would be a minimum of 432,000. This value increases to approximately 1.44 million data points for a string inverter project with about 1,000 tags. Handling such a significant volume of data points and performing analysis requires technological sophistication.
Portfolio-Level Analysis
Portfolio-level performance analysis & data monitoring for large-scale projects can present numerous hurdles. However, the primary challenges associated with managing a sizeable solar portfolio include the following:
• Conditional Diversity: Including Shading, Inclination, Orientation, etc.
• Asset Scale & Multitude: Utility-scale projects with MW scale plant capacities.
• Lack of Expertise: Larger team and stakeholders who aren’t solar professionals.
• Equipment Variations: Multiple inverter brands, tracker systems and solar panel technologies.
• Regulation Variations: Various national and local regulations and contractual obligations.
On the other hand, digitalised platforms successfully address the above challenges at various stages of performance monitoring. The following points outline the benefits of a digital solution:
• Digital solutions enable remote monitoring of PV plants, reducing man-hours and increasing O&M effectiveness.
• Digital solutions can create databases for equipment that can be replicated to configure various devices in the system.
• Data-driven corrective maintenance through digital solutions reduces the burden on solar professionals who can’t be deployed at multiple locations simultaneously.
Distributed Project Portfolios
Managing a variety of projects spread across different geographical locations often poses additional challenges:
• Clipped effects may cause errors in yield analysis.
• Season-dependent shading effects (for example, trees, chimneys, etc.) may also introduce inconsistencies in yield analysis.
• Monitoring databases can often encounter incorrect/missing base parameters such as tilt, orientation, etc.
• Localised irradiation measurement at each project can often be too expensive.
Project-Level Analysis
Generation Forecasts
The project-level analysis includes generation forecasts that typically leverage weather and satellite data, theoretical module degradation rates & statistical forecasting methods to offer accurate predictions. In addition, as an industry best practice, experts utilise two key KPIs, RMSE (Root Mean Square Error) and MAE (Mean Absolute Error), to validate the accuracy of these prediction reports.
Key Performance Indicators (KPIs)
Plant performance is tracked through fundamental categories of Key Performance Indicators: Plant KPIs and O&M Service Provider KPIs.
The Plant KPIs offer quantitative indicators that represent plant performance and yield. These include Reference, Expected and Specific Yield, Performance Ratio, Temperature Corrected PR, Energy Performance Index, Technical Availability (Uptime) and Tracker Availability. On the other hand, O&M Service Provider KPIs capture time-series data and maintenance aspects of the plant. These include Acknowledgement Time, Intervention Time, Response Time, Resolution Time, Schedule Attainment and Preventive v/s Corrective Maintenance Ratios.
Loss Bucketing
A fault-induced generation loss is considered a significant cause of concern when it impacts the Performance Ratio (PR) & Plant Availability beyond a threshold – measured throughout the monitoring/reporting period. As a best practice, the threshold should be set at 1% of Plant Availability or 1% of PR for a 1 month long reporting period.
The current state of the art in loss bucketing depicts a more detailed categorisation into the following verticals – Controllable, Partially-controllable, and Uncontrollable Losses – with further sub-categories. This is demonstrated in Figure 6.
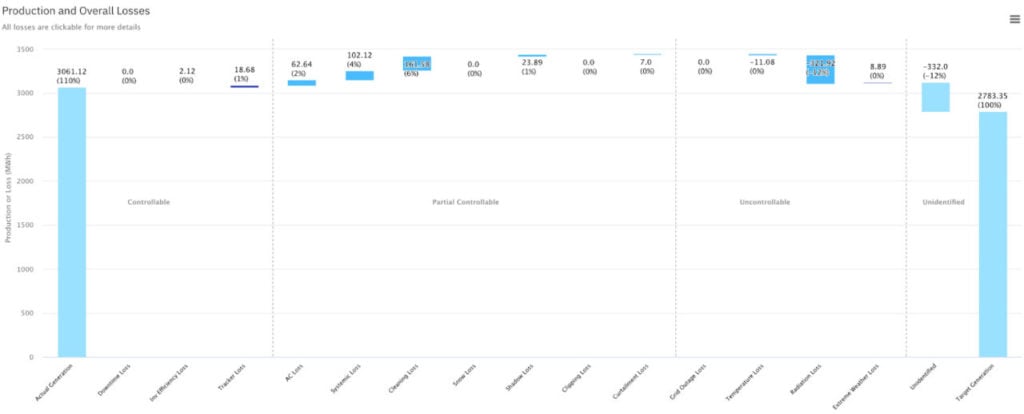
A robust analytics engine can also offer corrective/recommended action-based next steps.
Device Analytics
Fault Classification: From Plant to Inverter to String
Remote fault detection can be a suitable replacement for various investigative and inspective tasks traditionally performed by operation engineers.
Inverter-level faults can result in the following plant losses: AC Loss, Downtime Loss, Clipping Loss and Inverter Efficiency Loss. Systematic losses, on the other hand, include Shading and Cleaning Losses. In addition, there can also be other losses, such as Irradiation Loss. In such situations, using a top-down approach helps in functional analysis. It allows for identifying the faults straight from the inverter to the string-level and categorising them accurately to chalk out the required corrective actions. A typical 1MWac plant has approximately 100 strings (assuming 400 Wp module wattage, 28 modules/string and an AC/DC ratio of 1.2). With utility-scale plants of almost 200 MW, performing string analysis on 20,000 strings can be quite challenging.
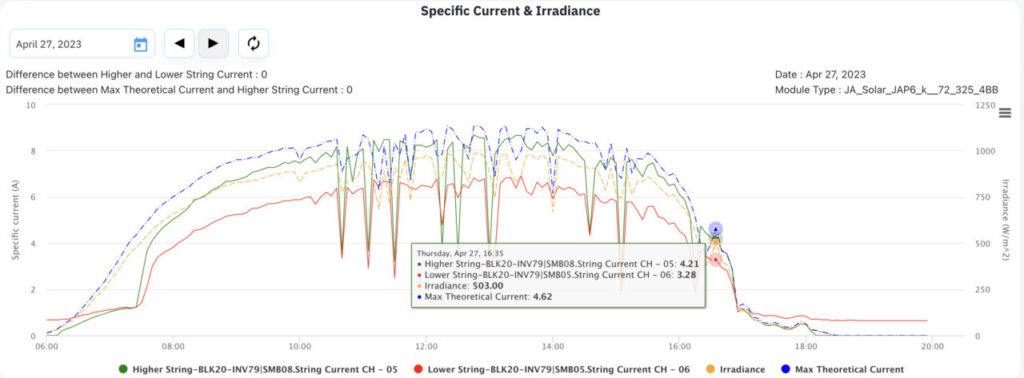
The following image [Figure 7] shows the performance of strings based on their current w.r.t, the best-performing strings, and their digital twins. This kind of string-level device analytics helps us rank string performance by estimating the deviation of the string current w.r.t the best-performing string and their digital twins.
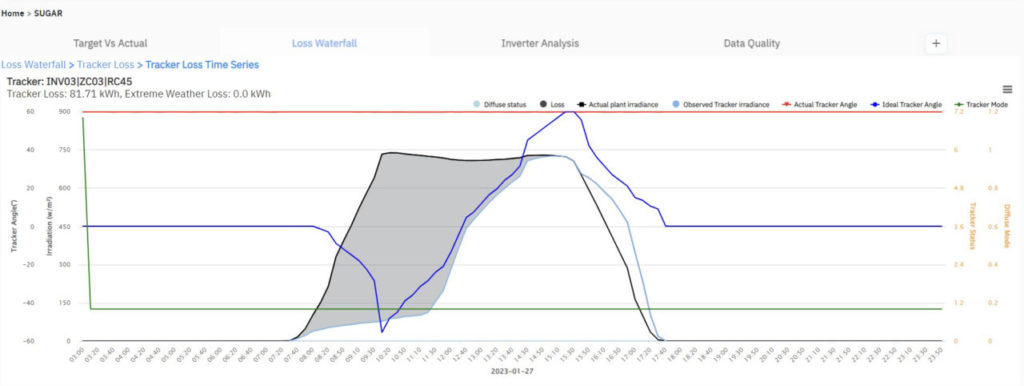
With the introduction of bifacial module technology in the solar industry, asset owners focus on adopting trackers in utility-scale plants. Performance Generation at the string-level can also be analysed through losses from trackers not operating correctly. The following image [Figure 8] shows the loss of energy generation due to the misoperation of trackers.
Big Data Mining algorithms can thus help in performing failure root-cause identification for larger portfolios as well.
Conventional Approach: Physical Models
The conventional approach to identifying issues in the solar plant is through physical models. For instance: Common photovoltaic faults associated with PV modules are generally one of the five key categories: Hot Spot Faults, Degradation Faults, Short Circuit Faults, Open Circuit Faults and Shading Faults.
Each fault category corresponds to a specific physical phenomenon and is identified using I-V & P-V Curves and models such as One-diode Model. However, this approach is highly time-consuming as it requires an in-depth analysis of large data values and requires a lot of subject matter expertise. AI-driven data models can address this issue by training large data sets on particular algorithms and making the process much more efficient.
Artificial Intelligence Data-Driven Models
Data-driven models with an Artificial Intelligence core are often applied across data preprocessing, processing and postprocessing techniques.
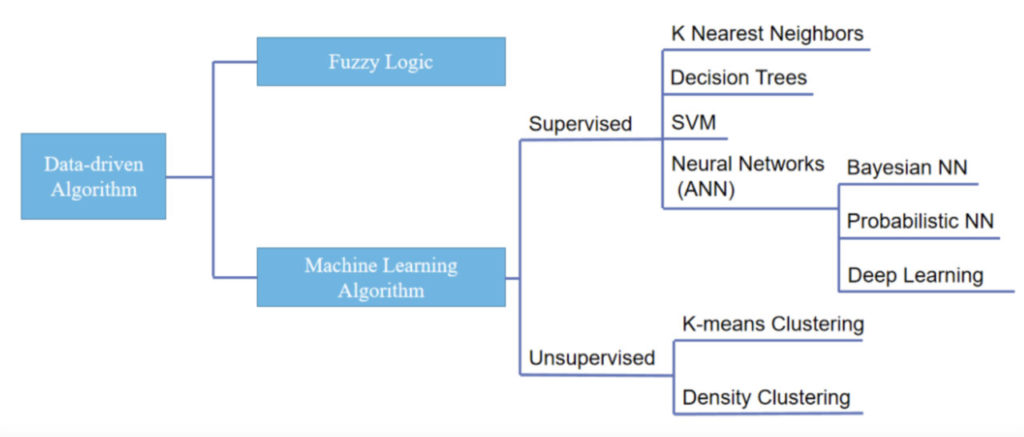
For example, the Pattern Recognition approach can identify shadow-related losses. Additionally, the correlation of plant parameters like irradiation w.r.t. string currents can be an ideal approach to perform string-level analysis and identify the string performance. Here, type analysis of the fault phenomenon associated with photovoltaic systems determines the appropriate Artificial Intelligence algorithms for fault detection modelling. For instance, Residual Neural Networks (ResNet), Bayesian Neural Networks (BNN), Probabilistic Neural Networks (PNN), Fuzzy-logic techniques, Artificial Neuron Networks (ANN), etc., and more.
Apart from fault identification, data preprocessing forms an assignable part of AI applications in the field of Solar Energy. Many experts have attempted, e.g., Kalman Filter Fast Fourier Transformation (FFT), to achieve clean data availability for expediting calculation speed.
Recommendations, Challenges and Way Forward
Globally, the size of Renewable Portfolios is now accumulating to meet the ever-increasing energy demands and net-zero emissions targets set by various world countries. For example, the US aims to achieve a total solar installation capacity of 850GW by 2030, eventually reaching a net-zero emission target by 2050.
Challenges for managing scale include requirements for additional subject-matter expertise, workforce and technological advancements in the future.
Including new devices and ever-advancing technologies further makes overall performance analysis even more crucial. Another challenge is the complexity of projects to drive/operate hybrid projects that integrate Solar Energy, Wind Energy and Battery Energy Storage Systems. Upgrading module technologies from standard Mono-facial Modules to HJT/TOPCon Technologies might pose unique challenges in field performance. Similarly, in BESS, adopting new battery technologies like Solid-state/Sodium-ion Batteries would require in-depth analytics from a performance point of view. These altogether result in making performance analytics even more sophisticated.
Conclusion
An effective approach is necessary to improve the underperformance identification process and reduce the time required to resolve device issues. In addition, this solution should allow for drilling down from the portfolio level to the string level quickly and efficiently. This would drive cost savings through reduced manpower requirements and increased energy generation. A digital solution, commonly called an Asset Performance and Management (APM) platform, to address these requirements is thus an essential means for renewable asset owners and operators.
Authors
Stuti Gupta is the Solar Lead at Prescinto, an AI-powered asset performance management platform for solar, wind and energy storage assets. Stuti brings a wealth of experience of working in the solar industry, focusing on asset management, design & engineering, and solar module technology. Besides her technology management role at Prescinto, she’s an alumna of the Indian Institute of Technology (IIT), Bombay, and holds a Master’s Degree in Renewable Energy Science.
Abhishek Puttanna is the Performance Excellence Head at Prescinto. Abhishek has worked in the renewable energy industry for more than seven years. He has rich experience in leading Digital Transformation, Performance Management & Operations of Utility-scale/C&I Solar and BESS projects. He holds an Electrical Engineering Degree from Delhi College of Engineering.


")

