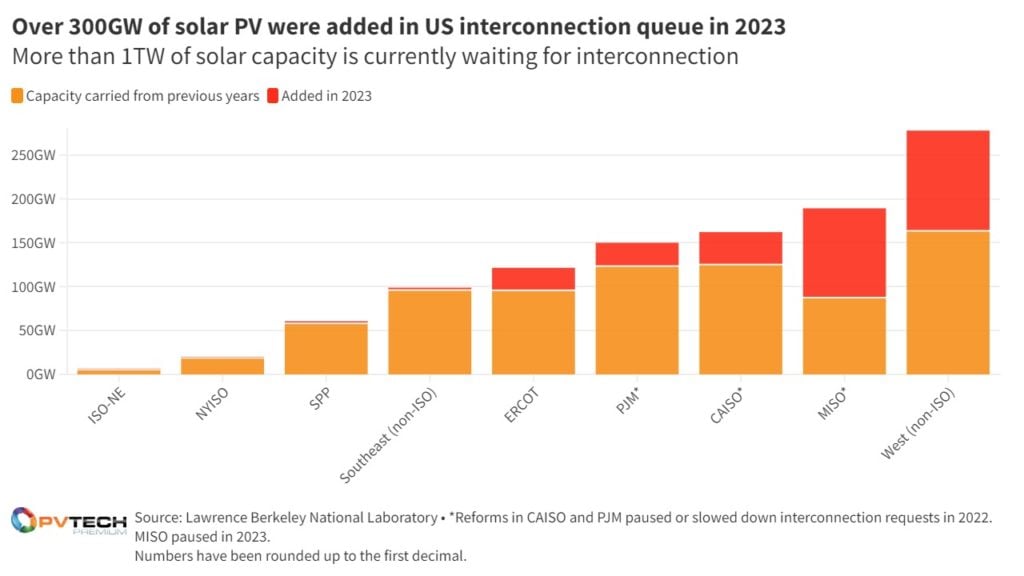
Interest in building solar and storage capacity in the US has never been bigger, with both technologies contributing over 1TW of capacity to the interconnection queue as of the end of 2023.
All technologies together account for 2.6TW of capacity awaiting for a grid connection, nearly trebling the numbers recorded just two years ago. Several factors have driven such a surge in renewables appetite across the US, including solar and wind’s increasing cost-competitiveness against fossil fuel resources and the need to replace older power plants.
Try Premium for just $1
- Full premium access for the first month at only $1
- Converts to an annual rate after 30 days unless cancelled
- Cancel anytime during the trial period
Premium Benefits
- Expert industry analysis and interviews
- Digital access to PV Tech Power journal
- Exclusive event discounts
Or get the full Premium subscription right away
Or continue reading this article for free
Another key aspect of the continued growth of solar projects waiting for interconnection access is how they are being driven through policies at all levels, says Joseph Rand, lead author of Lawrence Berkely National Lab’s (LBNL) latest report “Queued Up: 2024 Edition Characteristics of Power Plants Seeking Transmission Interconnection As of the End of 2023”.
Many utilities have decarbonisation commitments or targets which compel them to procure more clean electricity, while at a state level, many states have renewable portfolio standards which set targets to procure a certain amount of clean energy per year.
Finally, at the federal level, the Biden administration has set a target to reach a zero-carbon electricity sector by 2035. That is on top of the country’s most important environmental legislation, the Inflation Reduction Act in 2022. “It kind of supercharged what was already a pretty vigorous environment for clean energy development. It doubled down on that,” explains Rand.
“That, to some degree, explains the growth in volume that we’ve seen over the past several years. But at the same time, you have to ask if that cumulative capacity in the queues is also increasing because projects are coming in at a faster rate than they’re going out,” adds Rand.
FERC reforms to streamline process
Last year, the US Federal Energy Regulatory Commission (FERC) published a final draft rule to reform the procedures that govern interconnections in the energy grid and improve its efficiency. These rules could help reduce the ever-increasing pace of capacity added to the interconnection queue year after year.
“The goal is to speed up this information gathering process for developers so that, on the one hand, those who are already in the queues can clear out of the queue more quickly, so that the cluster study processes and later more detailed studies can really only focus on those that are feasible in the end. Hopefully, if that works, we will see a significant shrinking of the queues,” explains Joachim Seel, co-author of the LBNL report.
This also links to the fact that projects are taking longer to be withdrawn from the whole process of securing interconnection, says Seel, adding that: “The purpose of the reforms is for them to leave earlier, or provide enough information so that they don’t even propose infeasible projects.”
If the FERC reform is aimed at reducing the queues that have kept increasing, the US government has also been investing in its grid, with a US$331 million investment in Western transmission line earlier this month. And most importantly the Department of Energy’s Innovation e-Xchange (i2X) initiative – which encompasses stakeholders from all fields, including grid operators, utilities, developers or researchers, among others – aims to reduce interconnection queues, wait times and lower grid connection costs.
CAISO adds over 300GW capacity in the queue, led by batteries
Out of the seven ISO markets and the two non-ISO ones (West and Southeast), West (non-ISO) added the most solar capacity to the interconnection queue in 2023 and also has the most cumulative capacity still waiting for getting an interconnection agreement. The MISO region more than doubled the solar capacity in its grid backlog with an additional 101.7GW in 2023. This is on top of the 87.5GW capacity already in the queue from previous years. It is worth noting that MISO has paused its interconnection requests in 2023.
The picture changes slightly in terms of the number of active projects in interconnection queues. PJM is at the top with 3,065 proposed projects, all resources combined, while CAISO has less than 1,000.
This is taking into consideration that reforms in CAISO and PJM territories paused or slowed down interconnection requests in 2022, while MISO paused them in 2023. One of the factors for these ISOs to hit the pause button on new projects was to improve the process and allow them to provide more upfront information to developers, explains Seel. The development of these tools would allow developers to be better informed as to where the transmission lines might get overloaded and that they end up as up to date as possible too.
“In the case of MISO, a big reason why they opted to pause or delay their request window in 2023, is that they had pending reforms that were being reviewed by FERC,” explains Rand. Pausing the process does not necessarily remove the volume of capacity developers aim to build, as was the case in the CAISO region which saw an over 300GW capacity increase in the queue during 2023.
200GW of solar to be added until 2026
Despite the continued increase in solar capacity awaiting grid connection, the report highlights that the majority of the projects still in the queue have a proposed date to become operational by the end of 2026.
Out of the seven ISOs and two non-ISO regions researched in the report, five – CAISO, ERCOT, MISO, PJM and West (non-ISO) – have at least one year with over 40GW of solar proposed to come online before the end of the decade.
Moreover, aside from the CAISO region, which would see a peak in 2028 with 46GW of solar installed, most territories would reach the peak before 2026. Even though most of the 1TW capacity in the interconnection queue will most likely not be built, if only 20% of these projects – 14% in terms of capacity – end up being built (which would represent the historical percentage of requests reaching commercial operations from 2000-2018) it could still represent about 200GW of solar PV added in the coming years.

Looking state by state, Texas sits at the top of PV capacity awaiting grid interconnection, with 134GW. It is closely followed by California with 131GW. Unsurprisingly these are also the two states with the most installed solar capacity – as of 6 March 2024 – with California at 46.9GW and Texas at 22.9GW, according to data from trade association Solar Energy Industries Association (SEIA). Although fifth in the US in installed solar capacity with 7.7GW, last year Arizona had the third most solar capacity in the queue with 79GW.
The picture is slightly different when including other resources, and more particularly storage. In that scenario, California has the most capacity in the queue, with 445GW, more than half of which is from storage (275GW).
One of the ongoing trends highlighted by Berkeley Lab’s latest report is the ever-increasing trend of hybrid projects. More than half of solar PV projects in the queue are hybrid projects, most of which are paired with storage. Out of the 1TW solar PV capacity awaiting interconnection, 548GW out of the 571GW hybrid projects are solar-plus-storage.
California’s counties occupy half of the top 10
Finally, looking at the county level, California represents half of the top 10, and even the first four, led by Fresno County with over 60GW of capacity queued up at the end of 2023. Solar-wise, Fresno also has the most capacity queued up with nearly 28GW.
The other states represented in that list are Arizona, with two counties – Maricopa and La Paz –, Nevada, Oregon and Washington.
The latest edition of PV Tech Power 39 has a feature looking at the grid bottlenecks and how to solve this issue. The article can be accessed here.
| PV Tech publisher Solar Media will be organising the third edition of Large Scale Solar USA Summit in Austin, Texas 1-2 May. With the Inflation Reduction Act (IRA) targeting US$369 billion for clean energy and US$40 billion for manufacturing, the solar industry has never been brighter. The IRA, securing financing for future projects or supply chain bottlenecks will be among the discussions at this year’s event. A panel presentation about interconnection, its cost and waiting times will be held on the second day by Joachim Seel. More information, including how to attend, can be read here. |


