US PV manufacturing: how much capacity will actually be online by 2030? 

By Moustafa Ramadan
Facebook
Twitter
LinkedIn
Reddit
Email
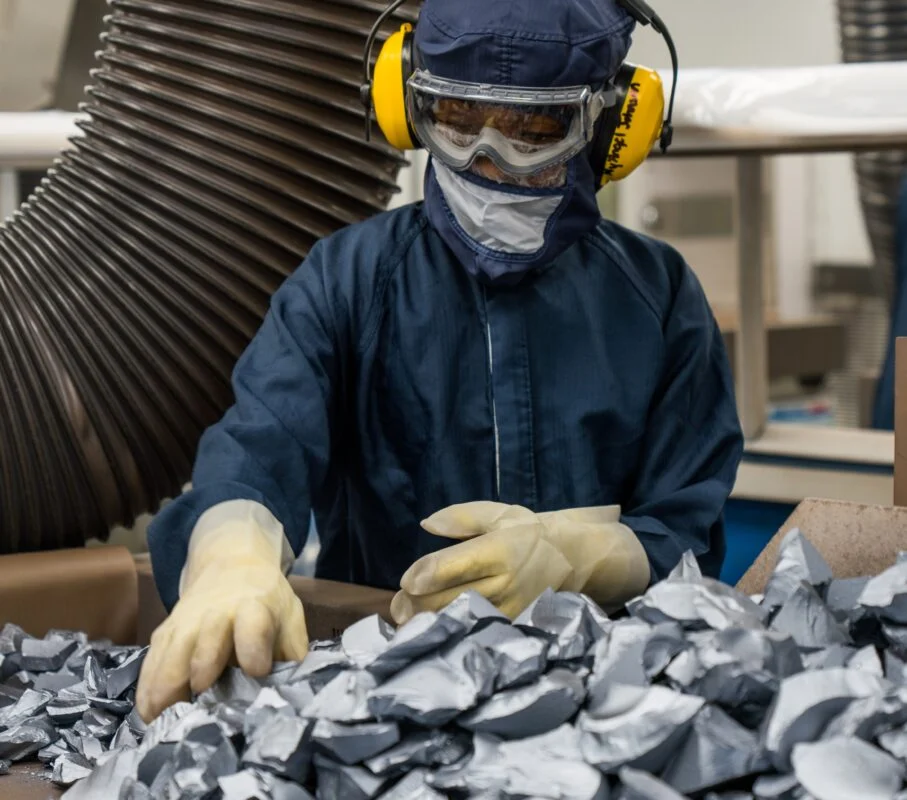
The US PV supply chain being built out up the value chain, with upstream bottlenecks emerging in areas such polysilicon. Image: Hemlock Semiconductor

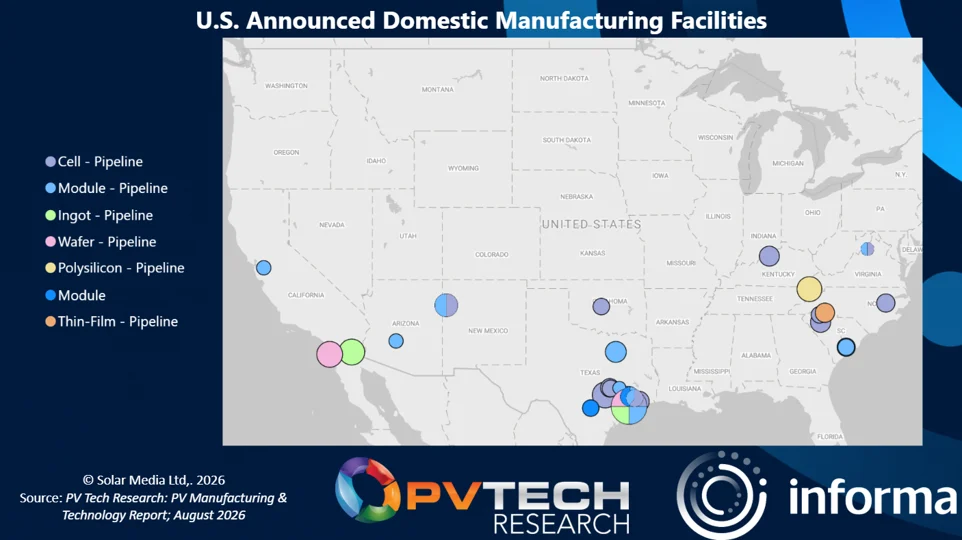
The United States has spent the past three years building the industrial base for a domestic solar supply chain that, on paper, looks increasingly complete. Polysilicon refiners, wafer producers, cell fabricators and module assemblers have all announced facilities at a pace unmatched in the sector’s history. Yet the gap between announcements and operational capacity tells a more complicated story – one where segments closest to the end customer have advanced furthest, while the upstream segments critical for supply chain sovereignty remain most vulnerable.  

Over the next five days, we will release a series of five articles examining data from PV Tech Research’s new US Domestic Solar Tracker report, setting the stage as we approach PV CellTech USA in mid-October and assessing how the market will evolve through 2027. The series will examine five themes tracing the evolution and future of US solar manufacturing.  

This article requires Premium SubscriptionBasic (FREE) Subscription

Try Premium for just $1

  • Full premium access for the first month at only $1
  • Converts to an annual rate after 30 days unless cancelled
  • Cancel anytime during the trial period

Premium Benefits

  • Expert industry analysis and interviews
  • Digital access to PV Tech Power journal
  • Exclusive event discounts

Or get the full Premium subscription right away

Or continue reading this article for free

Day 1 compares announced capacity against operational reality across polysilicon, wafers, cells and modules, asking what will realistically be online by 2030. Day 2 maps the supply chain, from upstream to downstream, identifying where capacity is strongest, where critical gaps remain, and what this means for manufacturers and investors. Day 3 assesses which announced investments are progressing and which have stalled, explaining why project status matters more than headline gigawatts. Day 4 examines which cell technologies are being deployed and how these choices will shape cost and competitiveness through 2030. Day 5 presents the 2030 capacity forecast, highlighting growth inflexion points, import dependencies, and who stands to benefit.  

The cut-off point for the data underpinning this and subsequent articles this week was Wednesday 26 August 2026. 

The current footprint
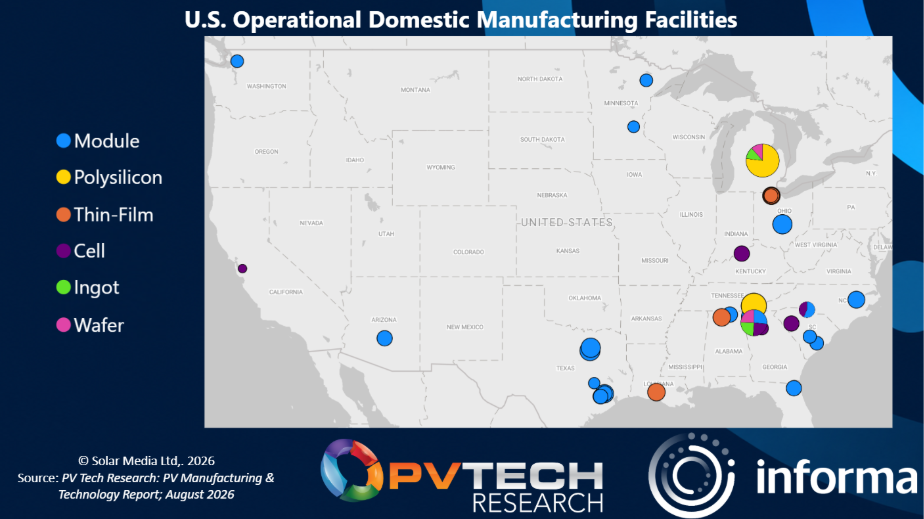
​According to PV Tech Market Research’s latest manufacturing and shipment data, US polysilicon capacity stands at 36GW, but only 15.5GW is currently allocated to PV production. This gap exists because US polysilicon capacity is shared with semiconductor-grade production, meaning a significant portion of the 36GW ceiling is unavailable to solar from the outset. Even accounting for this split, polysilicon remains the segment to watch most closely: any increase in semiconductor demand for the same feedstock would further squeeze PV allocation and impose a harder ceiling on how much of the downstream supply chain can be sourced domestically without imported material. This constraint has become more critical as Section 232 aims to limit the entry of polysilicon and its derivatives into the US. 

Wafer capacity is smaller in absolute terms but operates at higher utilisation rates: 5GW of solar-dedicated capacity against 3.2GW of production, which means a utilisation rate near 64%. While this figure appears modest, it reflects facilities still ramping up in 2026; from 2027 onward, utilisation is expected to exceed 70%. Wafer production remains the smallest segment of the domestic chain by volume and the most directly exposed to upstream polysilicon constraints. 

Cell manufacturing shows the clearest split in the data. Including First Solar’s thin-film lines, capacity reaches 26.5GW, compared with 19.1GW of production — a 72% utilisation rate that reflects mature, largely cadmium telluride-driven operations. Strip the thin film out, and crystalline silicon cell capacity falls to 10GW with only 5.2MWp of production, roughly 52% utilization. This is the segment where the announced pipeline is most aggressive relative to existing capacity, making it the one to watch most closely over the next eighteen months. 

Module assembly is, unsurprisingly, the most built-out link in the chain, given its lower capital intensity and shorter lead times. With thin film included, capacity stands at 77.3GW against 51.5 GW of production (67% utilisation); without it, 61GW of capacity produces 37.5 GW (61% utilisation). Module assembly was always going to scale first; the question this series will keep returning to is whether upstream segments can catch up before that headroom becomes a liability rather than an asset. 

Notably, utilisation rates serve as principal indicators of market demand for additional capacity. No factory operates at 100%, but any facility or segment running above 70% is approaching its capacity ceiling, signalling very high demand for the product. 

Announced versus operational: where is the gap?

Capacity announcements dominate industry headlines, but construction pipelines tell the real story. PV Tech Market Research’s tracking of credible projects currently underway reveals a fundamental imbalance: capital is flooding into downstream segments that already have headroom, whilst upstream bottlenecks remain underfunded. 

Cell manufacturing dominates the current construction pipeline, with 55.90GW of credible capacity underway—by far the largest single build-out of any segment, and consistent with the crystalline silicon cell shortfall identified above. Module capacity under construction adds a further 41.36 GW. Behind both, wafer capacity under construction totals just 13.3GW, while combined polysilicon and ingot capacity reaches 22.1GW. The imbalance is stark: for every dollar of committed cell capacity, comparatively little capital flows to the wafer and polysilicon stages that must scale in parallel if that cell capacity is to rely on domestic rather than imported inputs. 

The 2030 outlook, and why timing matters as much as volume 

The bulk of this build-out is timed for 2026 and 2027, and that timing is not incidental. Section 232’s polysilicon investigation, layered on top of the existing tariff and Foreign Entity of Concern (FEOC) compliance regimes, has pushed manufacturers across the chain to bring capacity onshore ahead of policy deadlines rather than in response to demand signals alone. That creates a genuine risk that the current wave of announcements reflects a rush to be compliant and eligible for support under the 45X, 45Y, and 48E credit structures, rather than a durable, demand-matched expansion. 

The data on capacity scheduled beyond 2027 is where that risk becomes visible. Cell capacity under construction with a post-2027 timeline totals 13.5GW, whilst module capacity scheduled for the same window reaches 8.6GW—both meaningful, but a fraction of the pre-2027 surge. Polysilicon is the exception, and a telling one: 8.8GW of credible polysilicon capacity under construction is scheduled for after 2027, meaning almost all of the segment’s committed expansion sits outside the near-term wave reshaping the rest of the chain. Given that polysilicon and wafers are the most constrained parts of the value chain, a build-out concentrated in the latter half of the decade means the industry’s most constrained input will likely remain constrained for longer than the cell and module figures alone would suggest. 

What determines whether the US hits its 2030 ambitions 

Three factors will determine how much of the announced pipeline converts into operational capacity by the end of the decade. First, whether polysilicon expansion, currently lagging in both PV availability and construction timing, can accelerate enough to feed the wafer and cell capacity being built ahead of it. Second, whether the crystalline silicon cell build-out, which accounts for the largest share of capacity currently under construction, avoids the kind of overbuild that outpaces both polysilicon supply and end-market demand. Third, whether the policy environment that triggered this wave of investment, Section 232, FEOC restrictions and the tax credit framework, remains stable enough that projects greenlit in 2025 and 2026 remain economically viable when they reach commissioning in 2027 and beyond. 

The data reveals a supply chain being built out up the value chain: downstream capacity racing ahead whilst upstream bottlenecks persist, construction timelines clustering around policy deadlines rather than demand cycles, and headline announcements masking an imbalance that threatens to leave cell and module capacity starved of feedstock, markets, or both.  

Tomorrow’s instalment maps the supply chain end-to-end, tracing how material flows from polysilicon through wafers, cells, and modules to identify where capacity is genuinely aligned, where critical mismatches create vulnerability, and what this means for manufacturers betting billions on domestic integration.   

The US Domestic Solar Manufacturing Tracker report will be fully launched at our PV CellTech USA conference in San Francisco on 13-14 October. For details and booking, click here.

13 October 2026
San Francisco Bay Area, USA
PV Tech has been running an annual PV CellTech Conference since 2016. PV CellTech USA, on 13-14 October 2026 is our fourth PV CellTech conference dedicated to solar manufacturing in the USA. From polysilicon, wafers, ingots, cells and modules, to critical component suppliers including glass and frames, the event connects every stage of the value chain under one roof. PV CellTech USA also brings together investors, innovators, manufacturers and industry stakeholders to collaborate and strengthen domestic solar manufacturing across the United States.

Read Next

August 28, 2026
Importing solar modules to the US will “no longer make any economic sense” under new Section 232 tariffs for polysilicon-based products, according to Intertek CEA.
August 28, 2026
Solar cell and module manufacturer Canadian Solar has shipped 3.1GW of modules in the second quarter of 2026, a 60% year-on-year decrease.
Premium
August 28, 2026
Complex site topography can have a crucial bearing on a PV system’s energy yield writes Solargis CEO Marcel Suri.
August 28, 2026
Deep Patel at Gigawatt Inc. writes about the emergence of FEOC restrictions that are reconfiguring the supply chain.
August 28, 2026
Hawke's Bay Airport has opened an EOI process for the delivery & co-investment partners for a proposed 12-17MW solar PV plant in New Zealand.
August 27, 2026
US- and Canada-based PV module producer Heliene is among the companies trialling a new American-made solar glass currently being tested for sale in the US market.

Upcoming Events

Solar Media Events
October 13, 2026
San Francisco Bay Area, USA
Solar Media Events
November 3, 2026
Málaga, Spain
Solar Media Events
November 24, 2026
Warsaw, Poland
Solar Media Events
February 2, 2027
London, UK