At the beginning of 2017, the big question regarding solar in China was whether they could repeat the stunning ~35GW performance of 2016. Yet, over the course of the year, the question transformed, quite surreally, to whether China would hit the 50GW mark in 2017 – essentially, the sum total installations of the rest of the world combined. In this article, we will address some questions that have been on everybody’s mind, namely: what exactly is causing the growth surge; is it possible that forecasts of 55GW actually underestimate the market; and what could possibly sustain this gargantuan, feed-in-tariff-fattened domestic industry in the next year and beyond.
Try Premium for just $1
- Full premium access for the first month at only $1
- Converts to an annual rate after 30 days unless cancelled
- Cancel anytime during the trial period
Premium Benefits
- Expert industry analysis and interviews
- Digital access to PV Tech Power journal
- Exclusive event discounts
Or get the full Premium subscription right away
Or continue reading this article for free
What is driving the 2017 surge?
Our previous article went into some detail on the various market segments that make up the Chinese PV market. In summary, we see four main market segments with distinct growth drivers in 2017, approximately broken down as follows:
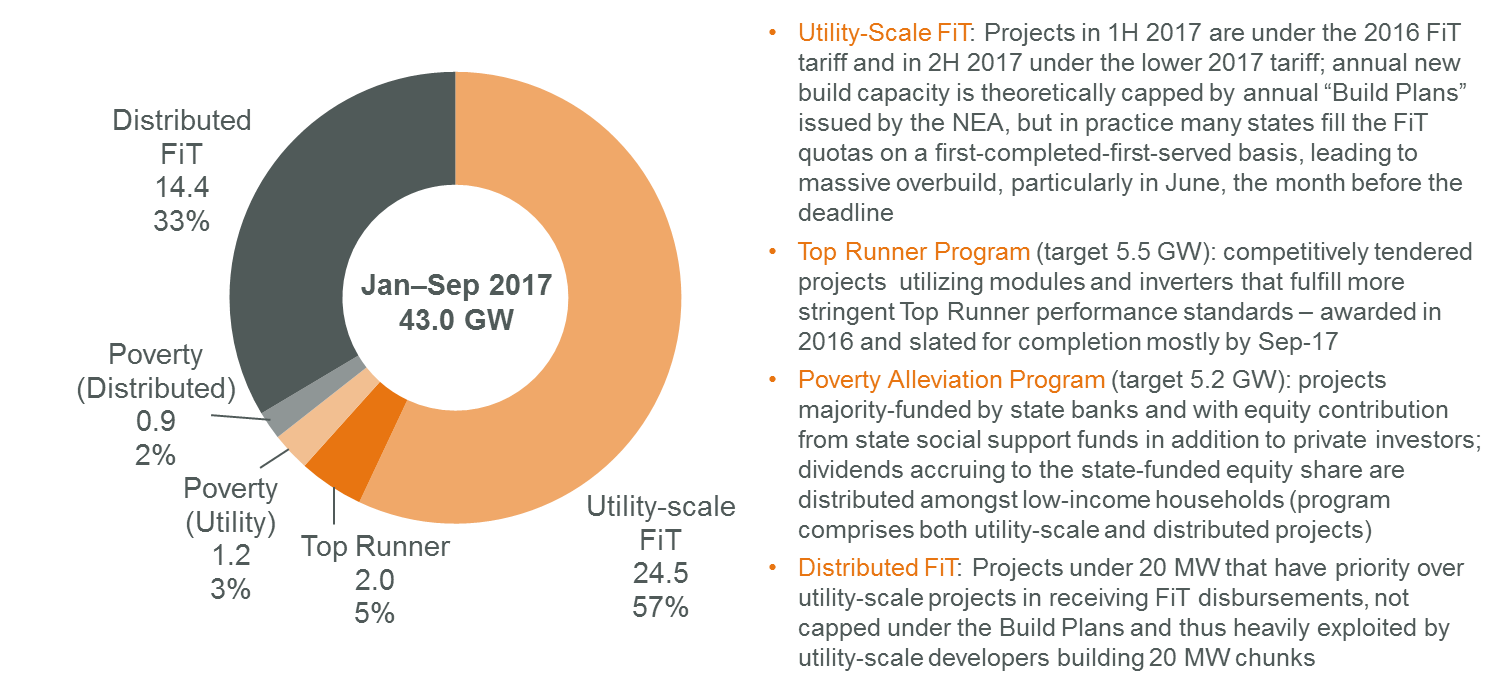
Despite the expansion of the Top Runner and Poverty Alleviation programmes this year, and the growing awareness of these programmes in the international community, both in reality contributed only a small percentage of this year’s demand. Of the 5.5GW planned for the Top Runner programme, reportedly only ~2GW had been completed as of October 2017, despite the deadline being September 30 for most projects. Progress on the 5.2GW Poverty Alleviation programme allocated in 2016 is likewise slow: while statistics are not published on a national level, Henan province, for example, had completed only 35% of their target as of October 2017, and Gansu only 44%.
The 2017 market is thus still primarily driven by utility-scale (>20MW) FiT projects. Subtracting the estimated Top Runner and utility-scale Poverty Alleviation projects from the 27.7GW total utility-scale projects built in the first three quarters of this year, we estimate the volume of utility-scale FiT projects to be 24.5GW, making up two-thirds of the installed capacity. To fathom why this volume is happening in China but not elsewhere in the world, recall that projects in 1H 2017 were installed at 2016 FiT rates of 0.80–0.98 RMB/ kWh (12–15 USD cents) at locations with solar irradiation upward of 1,300–1,600 kWh/m2 (equivalent to e.g., Brazil); projects in 2H 2017 were installed at stepped-down, but still very healthy, 2017 FiT rates of 0.65–0.85 RMB/kWh (10–13 USD cents). On top of this generous national support, many regions still offer further province-level and/or city-level incentives in terms of tariff and investment subsidies.
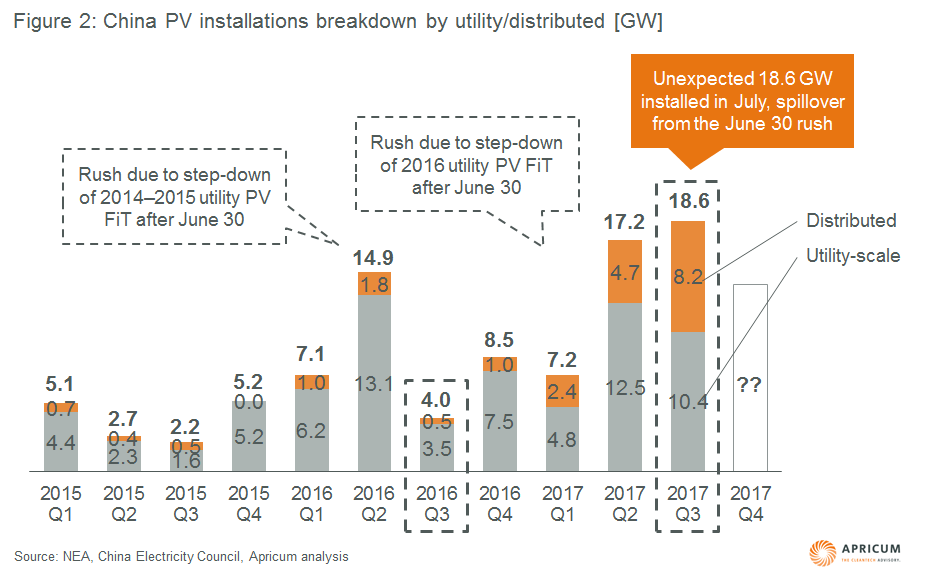
But while vanilla utility-scale FiT projects may be the work horse of the industry, the dark horse of 2017 is undisputedly distributed FiT. According to NEA statistics, by and large the Chinese solar market behaved in line with expectations for the first half of 2017, with June seeing the same installation rush as last year from the FiT deadline. But whereas Q3 last year saw a deep market slump as the pipeline emptied, Q3 2017 exceeded the Q2 peak, driven by a spillover from the June 30 utility-scale FiT rush and the – literally – exponential growth of the distributed PV segment.
Whereas distributed PV amounted to only 4.2GW in the full year of 2016, 2017 saw already 15.3GW installed within the first 9 months. Distributed PV FiT, unlike utility-scale FiT, is not subject to any (however weak) caps by regulators, and thus developers have carte blanche to develop as many sub-20MW projects as they can – the incentive is even greater when considering that in some regions and consumption models distributed projects enjoy higher FiT rates than utility-scale, and that distributed projects have priority over utility-scale in receiving the oft-delayed FiT disbursements. (“Distributed PV” in fact turns out to be a misnomer, as developers are using this scheme to build 20MW projects en masse, which would be classified as utility-scale anywhere else in the world.)
Where will China get to in 2017 – 50GW? 55GW? Breaking 60GW?
As of Q3 2017, a total of 43.0GW had been installed throughout the year. How much more can China build in Q4? Far from being fatigued, the local industry in fact expects a second installation “rush” in December, stemming from:
- An anticipated distributed PV FiT step-down: Mid-year 2017, an “official leak” surfaced that regulators will be stepping down the RMB 0.42/kWh national distributed PV FiT beginning January 1, 2018 (see our previous article on how the distributed FiT works); the cut, anticipated to range between 15–25%, has been widely expected, given that the RMB 0.42/kWh rate has never been lowered since it was introduced in 2014
- A host of provincial and local incentives that are slated to expire at 2017 year end, across both utility-scale and distributed segments
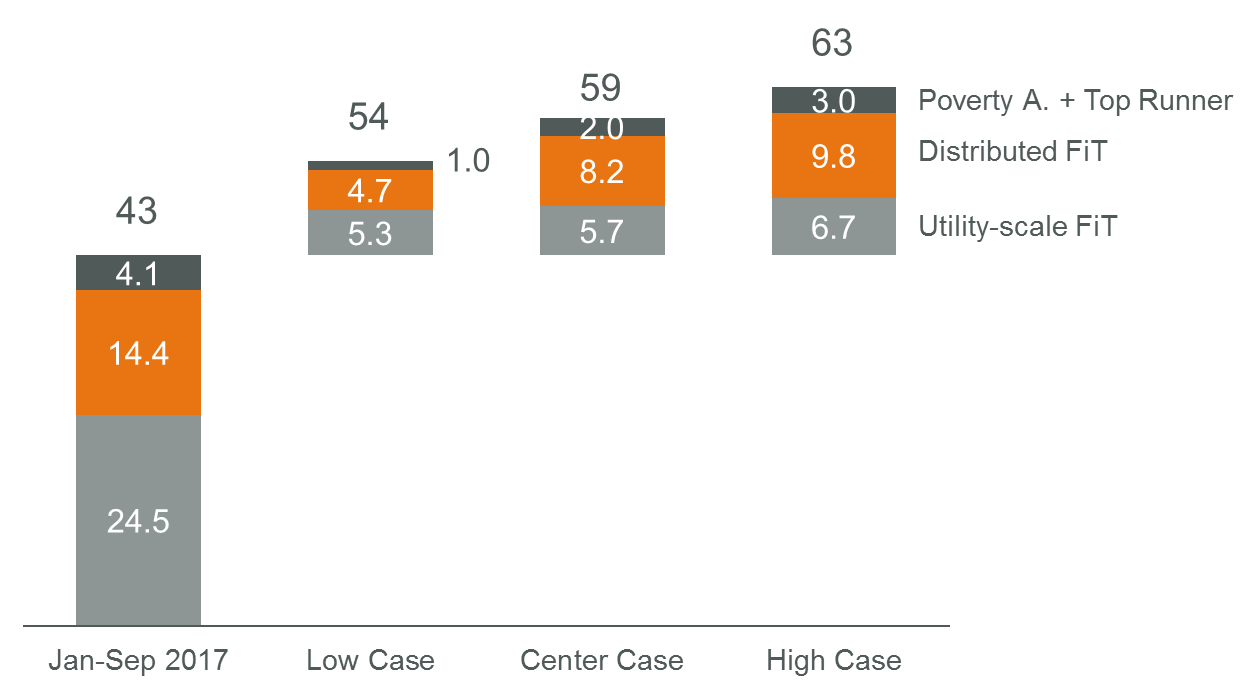
Apricum uses a segmental approach to forecast overall demand in 2017:
- Utility-scale FiT: While this segment is theoretically limited by the 2016/2017 Build Plans, these have not been very good predictors of actual build in the past. Thus, taking a more empirical approach, we see that in the past two years, utility-scale installations (prior to 2017, essentially all FiT-based) in Q4 are approximately 20% higher than in Q1. Therefore, for 2017 Q4, Apricum expects an upside of 10 to 40% over Q1 across our low to high cases, with the high end assuming an uplift from local incentive expiry
- Distributed FiT: Considering the growth trend of distributed PV over the year, how there is no cap on new build, and the threat of a potentially steep FiT cut, it is not difficult to imagine that Q4 will equal or even exceed the 8GW of Q3. In our low case, we assume installations at Q2 levels; in the center case, at Q3 levels, and in the high case, at 20% above Q3
- Poverty Alleviation and Top Runner projects: While an end-of-year push is typical, Apricum believes that given the low completion rate as of October 2017, it is unlikely that the full 5.2 + 5.5GW target would be completed. In our low, center and high cases, we assume a total of 1, 2 and 3GW additional new build respectively
Thus we reach 54GW in our low case, 59GW in our center case, and 63GW in our high case, above most other analysts’ forecasts.
The million dollar question: Will China be able to sustain an annual 50 GW+ market?
A study published by the China National Renewable Energy Centre (CNREC) in November 2017 recommended that China raise its official 2020 PV installation target from the current 105GW – already surpassed – to 200GW. Assuming that China reaches 130–140GW at the end of 2017, this target translates into an average of 23–30GW of annual new build, or in other words, a collapse of the domestic solar industry as it currently stands.
There is little chance that regulators would allow that to happen, and as such the relevance of such excessively low targets to mid-term China/global PV demand should be seen with a healthy dose of skepticism[1].
Instead, we offer several observations on trends that will likely dominate the Chinese solar industry for the remainder of the 13th Five-Year Plan period:
- The Top Runner programme expands, raises technical criteria: the 2017–2020 Build Plan by the NEA upsized the Top Runner programme to 8GW/year while at the same time extending the completion period to three years. When the results for Round 3 were released in early December, however, the NEA had only approved 6.5GW for 2017, consisting of 10 x 500MW so-called “Application Bases” [1] and 3 x 500MW “Technical Bases”[2], with different technical requirements for module efficiency and commissioning deadlines as follows:
| Multi- efficiency | Mono- efficiency | Deadline | |
|---|---|---|---|
| Application bases | 17.0% | 17.8% | 31 December 2018 |
| Technical bases | 18.0% | 18.9% | 30 June 2019 |
The prevailing sentiment is that the Top Runner programme is the lynchpin to achieving the greater objective of national PV grid parity by 2020. Thus the announcement of the 8GW/year plan cements the Top Runner as a contiguous, sizable programme and sends a strong signal to domestic players to continue the flurry of investments today into cutting edge R&D as well as high-efficiency production lines – application bases would provide the long-term market through, presumably, 2023 for the “new normal” of mass-market upgrades like PERC, while technical bases would ensure demand for the truly cutting-edge technology
- Poverty Alleviation programme is integrated into the mainstream FiT: becomes key to ensuring popular support for PV domestically: instead of a separate programme like the 5.2GW allocated in 2016, the 2017–2020 Build Plan announced that utility-scale FiT projects from 2017 onwards would automatically prioritise Poverty Alleviation projects in the selection and disbursement of subsidies; the Poverty Alleviation programme is thus intended to become a core pillar of the industry supporting both PV demand and ensuring popular political support
- Domestic margin squeeze as industry moves from subsidy to market-based pricing: regulators have time and again reiterated their focus on reducing the cost of solar. The industry today in all four market segments highlighted is still almost entirely reliant on tariff subsidies. The competitive bidding implemented in the Top Runner programme today and in some select provinces are mostly still cases of bidding down the subsidy. Margin decreases at home have already pushed Tier-1 Chinese companies to expand aggressively abroad; greater margin squeeze means Tier-2 players will also develop a greater international presence
- Distributed PV to serve liberalised power market: On October 31, 2017, the NRDC and NEA announced plans to set up pilot programmes allowing distributed PV facilities to sell to nearby electricity consumers; such distributed projects will continue to enjoy FiT and priority in receiving FiT disbursements. “Distributed” PV here is also more loosely defined to include projects between 20–50MW under 110 kV. These pilot programmes are to end, and actual implementation to begin, as early as June 30, 2018. While the surge in distributed PV may moderate after the FiT incentive is slashed, the liberalisation of the market means that private PPAs may become another demand driver in the near future – a key trend to watch
- Green certificates pilot programme to replace FiT?: In July this year, China issued its first batch of green power trading certificates to 20 pilot projects, to be available for purchase on a voluntary basis. Projects that receive green certificates would no longer benefit from FiT. As of October 2017, however, reception has been poor, with only 12,000 out of the 8 million issued certificates sold (or 0.15%; 90% sold to businesses, 10% to individuals). The government has however communicated the intention to implement mandatory green certificate purchase for certain industries as early as 2018 – another key trend to watch
So, will China be able to sustain growth at 50GW per year? While this figure may seem unreasonably high, it has to be put in the context of China’s gargantuan power demand. The 13th Power Five-Year Plan targets total installed power capacity of 2,000GW (including renewables). If the PV market sustains growth at 50GW/year over the next 3 years, it would put PV at ~300GW, or 15% capacity penetration. While this is not exceptionally high in comparison to other industrialised countries (e.g. Germany 20% or Italy 16% in 2015), the ability of the grid to absorb this level of variability differs vastly across regions, favoring of course, installations closer to population-dense demand centers.
We at Apricum believe that 50MW per year is sustainable, at least in the mid-term, and that this would increasingly be driven by distributed PV. We see three key risks that may inhibit PV growth: land scarcity, curtailment risks, and the inability of the increasingly-burdened Renewable Energy Fund to pay out the promised FiT. Distributed PV installations have the distinct advantage of utilising smaller pockets of land, which are more readily available than large land parcels; being built closer to demand centers – as installations shifted east this year, the overall national curtailment rate in the first nine months of 2017 has actually declined 3.8 year on year; and a potential to soon access more diversified sources of compensation via private PPAs.
As such, any analysis of the global PV market – prices, technology, module supply, market size – over the next few years should pay strong heed to the distributed PV market, the current wildcard in China, and how it continues to develop under the various pilot market liberalisation initiatives.
[1] At a recent NEA press conference in October, Li Chuangjun, the deputy director of New and Renewable Energies explained that the (ludicrously) low 105 GW target released in 2016 was based on 2015 data, determined at a time when the cost of PV was far higher than today and when the electricity demand growth rate was 0.5%, compared to today’s 6.9%.
[2] A “base” being a cluster of projects organized and tendered in a specific region by the local authorities – a regional tender, so to speak. In an uncommon stroke of planning, the NEA is holding the remaining 1.5 GW in reserve to award to the three top-performing bases in meeting commissioning deadlines and technical requirements, and in securing the most discounted tariff rates to the local FiT.
[3] While the idea of “technical bases” had already been introduced in Round 2, it was then generally defined as projects utilising the most advanced technologies – Round 3 now establishes some quantitative criteria.


")
