
The financial and technological impact of weather variability on solar projects is as significant as it is unavoidable. From a financial point of view, variability often causes overestimated energy yield predictions, while technically, it contributes to suboptimal system designs that fail to account for the full range of weather conditions.
To mitigate these risks, solar industry professionals must adopt better planning strategies and more granular datasets to improve accuracy, reduce financial uncertainty and design PV systems that are more resilient to variability and extreme weather events.
Try Premium for just $1
- Full premium access for the first month at only $1
- Converts to an annual rate after 30 days unless cancelled
- Cancel anytime during the trial period
Premium Benefits
- Expert industry analysis and interviews
- Digital access to PV Tech Power journal
- Exclusive event discounts
Or get the full Premium subscription right away
Or continue reading this article for free
In this article, I explore short-term (intra-hourly) and long-term (interannual) solar variability and climate change. I also discuss the risks these factors pose to PV projects and offer practical solutions to manage these challenges more effectively.
Moving beyond hourly data
Short-term variability refers to rapid fluctuations in solar radiation and environmental conditions that occur within minutes. These include passing clouds, strong winds, flash floods and sudden temperature drops, all of which impact solar power plant performance. When tackling short-term variability, high data granularity matters.
Most industry models rely on hourly Typical Meteorological Year (TMY) data, which aggregates data into a typical representation of a year, providing only a picture of averaged values. PV simulations with low-granularity TMY datasets often yield overly optimistic predictions and suboptimal system designs, because they smooth out any fluctuations in weather conditions and do not allow to anticipate and plan for ’non-typical’ weather scenarios.
For example, sudden drops or fast changes (ramps) in solar radiation may come as an unwelcome surprise and cause grid instability. For this reason, developers need data with a shorter time resolution than hourly, to be able to better predict these events and prepare for high-frequency changes of weather.
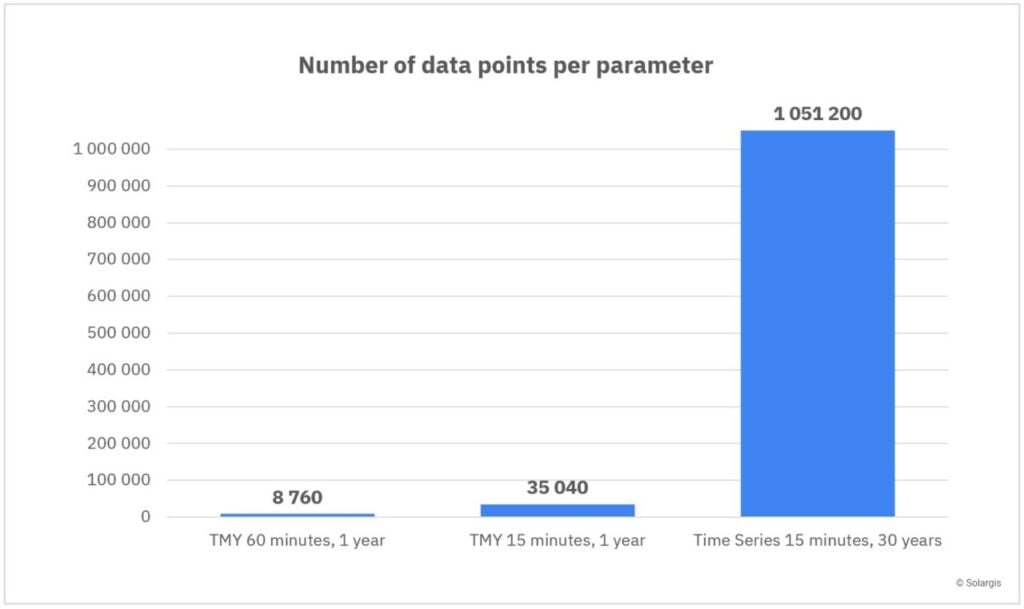
To compare, while hourly TMY works with 8,760 data points per year (24 hours a day multiplied by 365 days), 15-minute time series data provides over one million data points per parameter, breaking each respective hour into additional 15-minute intervals.
Transitioning from low-resolution hourly datasets to high-resolution data ensures that system simulations better reflect real-world weather variability, providing more accurate energy yield predictions and thus enhancing operational decisions and mitigating loss of revenue. In tackling weather fluctuations, 15-minute data offer unparalleled accuracy compared to datasets with an hourly resolution.
High-resolution time series data as the new standard
Interannual variability occurs due to natural atmospheric and hydrological cycles that cause yearly changes in solar radiation. These cycles naturally result in variability—some summers are hotter, colder, sunnier, or cloudier than others.
These cycles range from a few months to multiple years and decades and their effect combines in a complex regional pattern of year-on-year variability modulated by stochastic events. A well-known example is El Niño, which repeats periodically. An important contributing factor to the natural forces is human-induced climate change.
This type of variability significantly affects energy generation, leading to revenue fluctuations. Increasing occurrences of weather extremes catch solar developers and investors by surprise more often than any time before. One of the reasons for such unexpected revenue losses when actual production falls below expectations is the fact that financial models typically rely on yearly averages, provided by TMY data.
TMY datasets only provide long-term averages, hiding the actual year-to-year deviations from that influence project financials. Therefore, TMY is insufficient for due diligence because what truly matters to investors and developers is understanding potential risks that may undermine the predicted revenues.
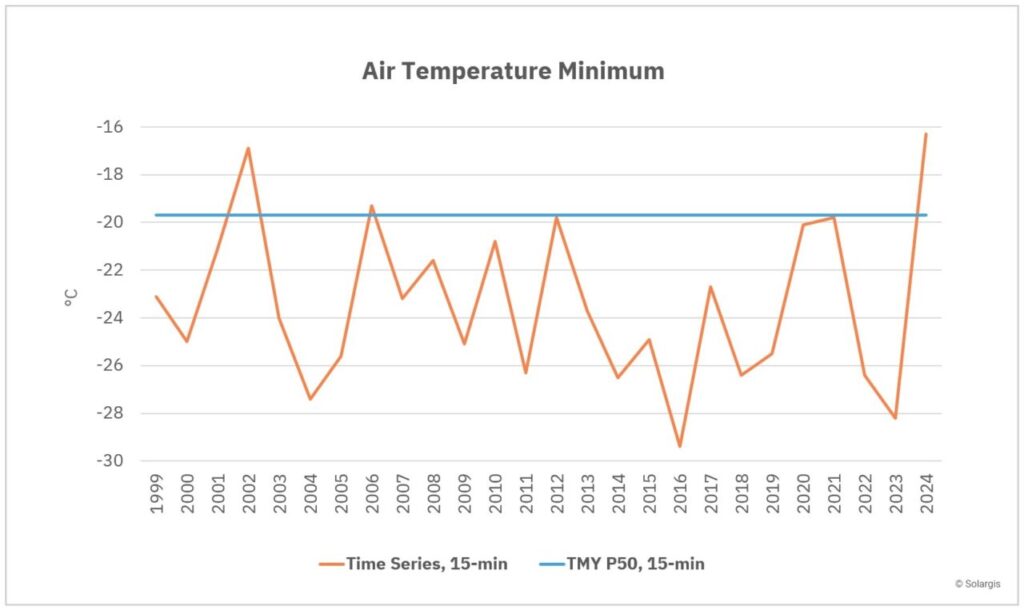
The following graph illustrates the difference in air temperature minimum values recorded throughout years for a given time period by 15-minute time series data and 15-minute TMY data. While the TMY dataset shows the average minimum temperature, the time series data provides a detailed view of minima over multiple years.
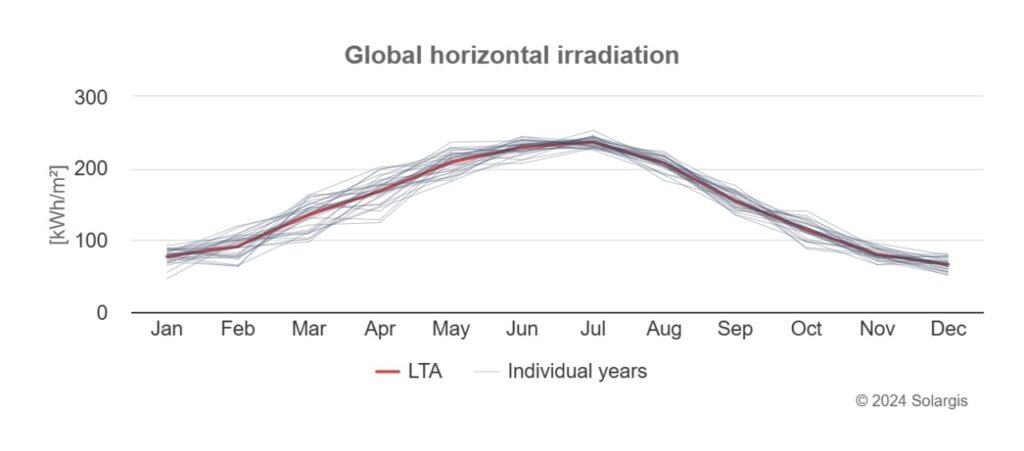
For example, a TMY dataset might suggest that March typically receives a certain amount of solar radiation. However, year-on-year (YoY) analysis may reveal that some years are far above or below this ’typical’ value, revealing previously unseen revenue volatility.
Having access to detailed time series data covering multiple years helps understanding these patterns for better PV system designs. It also allows investors and developers to better prepare for:
- How much energy will be produced in the best and worst years and months—not just the average.
- How revenue can and will fluctuate due to YoY variability.
- The real technology and financial risks if a project underperforms due to unexpected weather conditions.
- Bankability and due diligence, providing lenders and investors with more accurate risk assessments.
High-resolution time series data help PV developers to avoid surprises and better understand and manage both short-term and long-term variability. It is in the interest of all the solar industry to adopt time series as the new standard and replace the hourly TMY datasets.
The need for long-term historical data
Climate change is a growing concern, affecting solar resource availability globally. However, its impact is not uniform across regions—while in some areas, the effects of climate change may result in increased levels of solar radiation, other regions face increasing cloud cover or air pollution.
While short-term and long-term variability are part of natural cycles, climate change skews these natural patterns, making historical patterns less predictable.
While we do not fully understand climate change and its effects, analysing solar and meteorological data covering the longest possible history provides an invaluable understanding into the climate trends. Often, PV developers and experts believe that the most recent years’ data provide a better representation of current climate conditions and so they opt for studying the ten-year or 15-year historical datasets.
However, relying solely on data from recent years leads to misleading conclusions. For instance, a short-term dataset may overrepresent specific weather patterns, skewing long-term projections.
When it comes to accounting for climate change, there are no shortcuts. To truly map and distinguish between natural fluctuations and possible climate trends, it is crucial to analyse long-term datasets spanning as many years as possible. For example, for Europe, Africa and the Middle East, solar data from satellite-based models for more than 31 years is available.
More than 30 years of historical data provides a much better understanding of regional climate trends and related risks, than studying, say, the last ten years of data history.
Ignoring climate trends can lead to underperformance and financial losses in solar projects. Let me conclude with a few points to keep in mind when it comes to managing climate change.
- To observe long-term trends, we must analyse the longest possible dataset. Studying longer historical datasets ensures accurate estimates and prevents misleading conclusions
- Climate change must be analysed regionally, as trends vary widely across different parts of the world. Some regions may experience stronger trends, while in others, the trends are insignificant.
- Climate trends are small signals within a large volume of data. Only high-quality, validated data can capture the subtle climate change signals, requiring rigorous data verification and quality control to ensure reliability.


