
The third quarter of 2026 proved to be a pivotal period for the global inverter market, marked by aggressive manufacturing capacity expansion in the US, a landmark regulatory shift targeting foreign-made communication-enabled inverters and a notable reshuffling of bankability rankings as Chinese manufacturers saw their financial scores erode.
This article examines the major developments in the inverter market during Q3 2026, drawing on the PV InverterTech Bankability Ratings Report for its analysis and detailed findings.
Try Premium for just $1
- Full premium access for the first month at only $1
- Converts to an annual rate after 30 days unless cancelled
- Cancel anytime during the trial period
Premium Benefits
- Expert industry analysis and interviews
- Digital access to PV Tech Power journal
- Exclusive event discounts
Or get the full Premium subscription right away
Or continue reading this article for free
US manufacturing capacity accelerates past 60GW
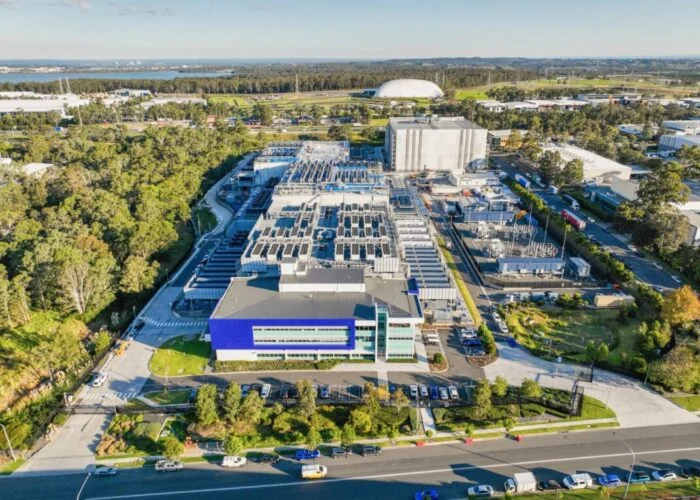
Annual inverter manufacturing capacity in the US surpassed 60GW during Q3 2026, with industry forecasts pointing to over 70GW by year-end. Several major facility expansions drove this growth. EPC Power opened a 167,000-square-foot facility in Fountain Inn, South Carolina, in July 2026, nearly tripling its production capacity and adding 27GW of annual output, with potential expansion to 40GW.
Power Electronics, meanwhile, broke ground on what will become the largest power conversion systems manufacturing campus in the US in September, a 53-acre site in Houston, Texas, expected to deliver 40GW of annual capacity and create more than 400 jobs once fully operational.
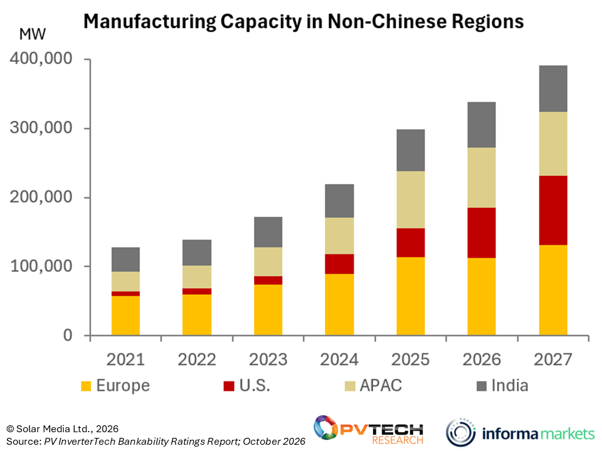
European-based annual inverter manufacturing capacity reached 113GW in Q3 2026, though no new manufacturing facilities were announced in the region during the quarter. India’s annual manufacturing capacity reached 66GW, continuing its steady build-out as a regional manufacturing hub.
The FCC ban: A turning point for foreign-made inverters
A significant regulatory development took effect on 28 July 2026, and was revised on 20 August 2026: the Federal Communications Commission (FCC) banned foreign-produced utility-interactive inverters with remote communication capabilities—both wireless and wired—from entering the US market. Exemptions apply for manufacturers compliant with Section 45X domestic manufacturing requirements.
This ban has immediate implications for Chinese and other foreign manufacturers reliant on exporting communication-enabled inverters to the US, likely accelerating the shift toward domestic production or US-compliant manufacturing partnerships to maintain market access.
Global manufacturing capacity outpaces demand
Globally, annual inverter manufacturing capacity reached 1,377GW in Q3 2026, while trailing 12-month (TTM) production stood at 825GW, implying a utilisation rate of around 60%. This drop in utilisation is largely attributable to the scale of ongoing capacity expansions outstripping near-term production needs.
Demand tells a similar story: TTM demand for Q3 2026 reached 792.5GW, representing just 57.55% of total global manufacturing capacity. This widening gap between capacity and demand signals a market that appears, on the surface, increasingly oversupplied.
However, this headline figure needs regional context. Around 76% of global manufacturing capacity is concentrated in China, meaning the apparent surplus is heavily skewed by a single region rather than reflecting a broadly distributed global imbalance.
Looking at regional inverter demand from 2021 through 2027 tells a different story: every tracked region—Europe, India, the US, Latin America (LATAM), the Middle East and Africa (MEA) and the rest of the world (RoW)—shows consistent, often rapid growth in inverter demand over the period.
Europe remains the largest demand market, rising from 57GW in 2021 to a projected 160GW by 2027. India shows the steepest relative growth, climbing more than tenfold from 10GW to 101GW. The US grows from 34GW to a projected 91GW, with LATAM, MEA and RoW each more than tripling their demand over the same period.
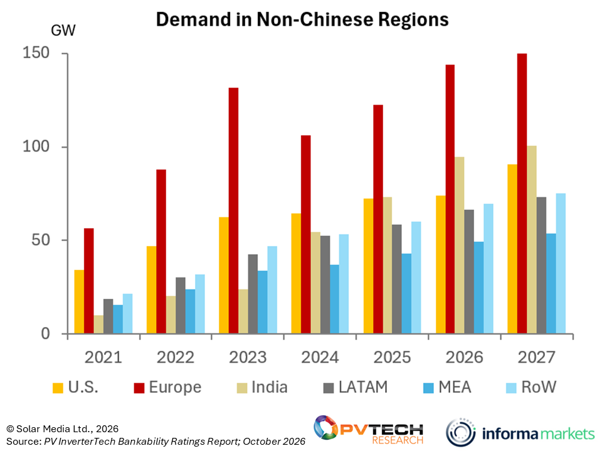
This matters because it shows demand growing robustly and broadly, not stagnating. When set against the fact that China alone holds roughly three-quarters of global manufacturing capacity, the picture of “global oversupply” looks less like a genuine lack of demand and more like a concentration problem: too much capacity sitting in one region relative to where demand is actually growing.
Markets like the US, which are simultaneously ramping up domestic demand and domestic manufacturing capacity (via EPC Power and Power Electronics), are moving toward a more balanced, locally matched supply-demand profile, rather than contributing meaningfully to the global oversupply figure. The real risk of oversupply, in other words, is concentrated in China’s own capacity base rather than in the diversified set of regional markets now actively building toward self-sufficiency.
Bankability rankings shift as Chinese financials weaken
Perhaps the most consequential development in the Q3 2026 bankability report was the broad decline in rankings among high-performing Chinese manufacturers, driven primarily by share price erosion following the FCC ban announcement.
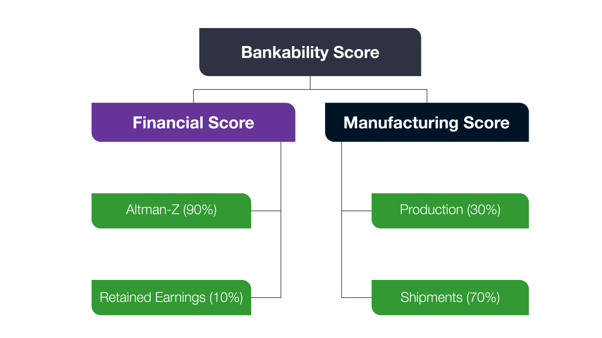
Sineng Electric offers the clearest example. The company had been positioned at AA, with a credible path to a top-tier AAA rating, supported by one of the strongest manufacturing scores in the industry thanks to its high production capacity and shipment volumes across multiple regions.
However, a declining Altman Z-score, a measure of financial distress, kept its financial score depressed. Through 2026, continued share price erosion drove the Altman Z-score and financial score down further, pulling Sineng’s overall rating down to an A in Q3 2026.
What this means for bankability going forward
The combination of China’s capacity concentration and the FCC ban’s market access restrictions creates a structural tailwind for non-Chinese manufacturers, and the regional demand data reinforces why this isn’t a short-term blip.
As shown above, demand is growing steadily and broadly across every region tracked (Europe, India, the US, LATAM, MEA and RoW), rather than being concentrated in one or two markets.
This matters for bankability in two ways. Demand growth gives non-Chinese capacity somewhere to go. European manufacturers expanding US-based production aren’t just filling a regulatory gap created by the FCC ban; they’re stepping into a US demand market projected to grow from 74GW to 91GW between 2026 and 2027 alone. That gives their capacity expansions a credible demand base, strengthening both their manufacturing and financial scores in bankability assessments.
It also widens the gap between scale-driven and fundamentals-driven rankings. Chinese manufacturers like Sineng Electric still command bankability scores built on scale and shipment volume, but as outlined earlier, deteriorating financial scores, driven by falling share prices tied to FCC ban sentiment, are pulling against that scale advantage. Meanwhile, European manufacturers benefit from a dual tailwind: growing regional demand to sell into and improving regulatory positioning in the US specifically.
Put together, the risk for Chinese manufacturers isn’t just losing a single export market; it’s that robust, diversified regional demand growth is actively being captured by competitors who are simultaneously building the domestic capacity to serve it. For bankability purposes, this suggests the gap between top-tier (AAA) and mid-tier (BBB) Chinese manufacturers is likely to widen further unless financial fundamentals stabilise, while European and other non-Chinese manufacturers with US-facing capacity expansions are positioned to see sustained bankability improvements through 2027.
Learn more about the PV InverterTech Bankability Ratings Report.