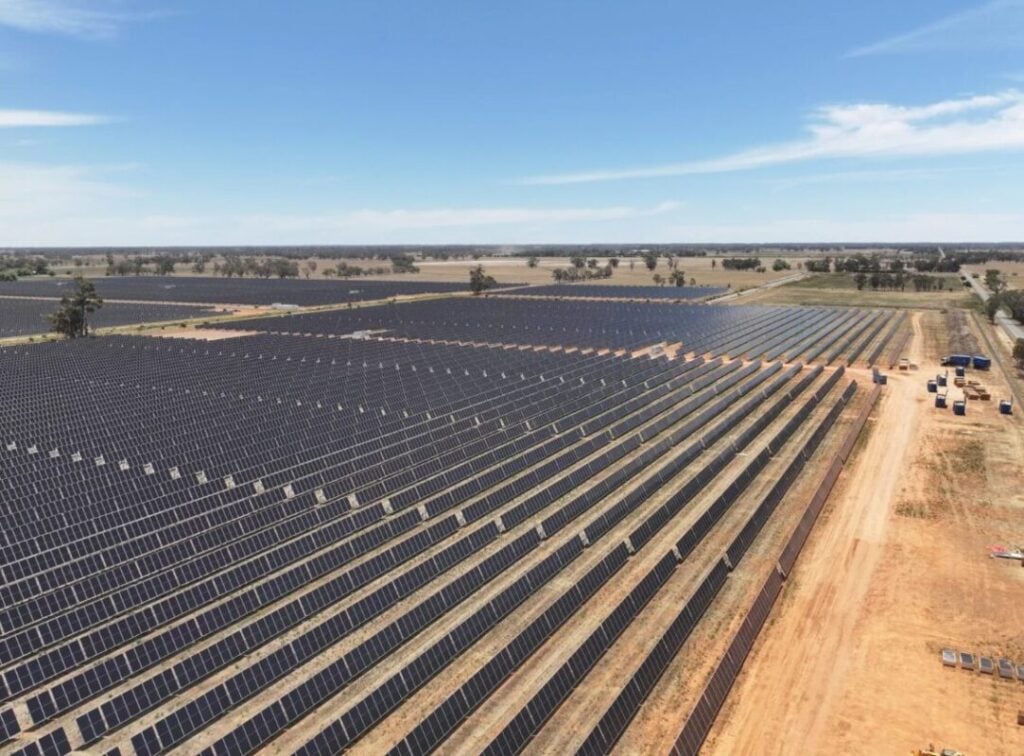
March 2026 marked a decisive shift in Australia’s solar generation landscape as the National Electricity Market (NEM) transitioned firmly into autumn, with both utility-scale and rooftop solar experiencing declines following the record-breaking summer.
Meanwhile, pricing dynamics revealed a more stable market environment punctuated by isolated volatility events.
Try Premium for just $1
- Full premium access for the first month at only $1
- Converts to an annual rate after 30 days unless cancelled
- Cancel anytime during the trial period
Premium Benefits
- Expert industry analysis and interviews
- Digital access to PV Tech Power journal
- Exclusive event discounts
Or get the full Premium subscription right away
Or continue reading this article for free
Analysis of data sourced from Open Electricity (formerly OpenNEM) reveals a seasonal downturn in March, with combined solar generation falling significantly as daylight hours shortened and solar irradiance declined.
However, the month’s pricing patterns demonstrated a marked departure from February’s extreme volatility, suggesting improved grid stability even as generation capacity contracted with the changing seasons.
March delivered a combined solar generation of 4,332GWh, representing a 5.4% decline from February 2026’s 4,572GWh and a 24% decrease from January’s record 5,698GWh. This month-on-month contraction reflects the typical seasonal trajectory as Australia moves away from peak summer conditions.
Autumn transition drives generation decline across both segments
Utility-scale solar generated 1,773GWh in March 2026, marking a 3.4% decrease from February’s 1,836GWh and a 20.6% decline from January’s record 2,234GWh.
Despite this seasonal contraction, the segment showcased notable resilience when viewed year-on-year, with March 2026’s output representing a 15.9% increase from March 2025’s 1,530GWh.
Rooftop solar experienced a more pronounced decline, generating 2,559GWh in March 2026, representing a 6.5% decrease from February’s 2,736GWh and a substantial 26.1% decline from January’s 3,464GWh.
This steeper contraction reflects the distributed segment’s heightened sensitivity to seasonal variations.
However, year-on-year comparisons reveal continued growth, with March 2026’s generation representing a 9.9% increase from March 2025’s 2,329GWh, demonstrating ongoing capacity additions across Australia’s residential and commercial rooftop installations.
The data reveals a continued evolution in the generation balance between segments. Utility-scale solar accounted for 40.9% of total solar output in March 2026, compared to rooftop solar’s 59.1%, representing a 1.44:1 ratio.
This marks a further narrowing from February’s 1.47:1 ratio and January’s 1.55:1 ratio, indicating that utility-scale solar maintained a more stable generation profile during the autumn transition while rooftop solar experienced proportionally greater seasonal impacts.
Daily generation patterns expose autumn variability
Daily generation patterns throughout March 2026 showcased the increased variability characteristic of autumn conditions.
Utility-scale solar output ranged from 40GWh on 18 March to 73GWh on 10 March, reflecting an 82.5% spread. This represented greater daily volatility than the 58% spread in February, suggesting more challenging, unpredictable generation conditions.
The segment achieved output above 65GWh on only eight days throughout the month, with pronounced week-to-week variability highlighting the impact of transient weather systems.
Rooftop solar exhibited even more dramatic daily variation, spanning from 42GWh on 19 March to 103GWh on 5 March, representing a 145.2% spread.
This substantially exceeded February’s 63.5% spread, revealing the distributed network’s heightened sensitivity to changing weather patterns. The segment-maintained output above 90GWh occurred on only nine days, significantly fewer than the fourteen days above 100GWh in February.
The highest combined solar output occurred on 5 March, when utility-scale and rooftop solar together generated 169GWh. While representing the month’s peak performance, this fell dramatically short of February’s highest daily output of 195GWh and January’s record 222GWh.
Conversely, the lowest combined output was recorded on 19 March, when utility-scale solar generated 43GWh and rooftop solar produced just 42GWh, resulting in a total of 85GWh.
Pricing stability returns amid isolated volatility events
March 2026’s pricing environment delivered a marked departure from February’s unprecedented volatility.
Utility-scale solar prices ranged from AU$-0.26/MWh (US$-0.18/MWh) on 14 March to AU$111.90/MWh on 19 March, representing a range of AU$112.16/MWh.
This volatility was substantially lower than the AU$208.27/MWh range in February, indicating improved market stability. The segment experienced only one negative pricing event throughout the month, occurring on 14 March when prices fell to AU$-0.26/MWh.
Rooftop solar faced more volatile pricing conditions, with prices spanning from AU$-6.78/MWh on 14 March to AU$109.58/MWh on 19 March. This AU$116.36/MWh range, while substantial, represented a major improvement from February’s unprecedented AU$457.03/MWh range.
Rooftop solar experienced negative pricing on four occasions during the month: 8 March (AU$-3.21/MWh), 13 March (AU$-0.13/MWh), 14 March (AU$-6.78/MWh), and 29 March (AU$-3.78/MWh).
These events reflected periods of oversupply relative to demand, particularly during mild autumn days when solar generation remained robust while electricity consumption declined from summer peaks.
The most significant pricing event occurred during 17-19 March, when both segments experienced their highest prices of the month. Utility-scale solar reached its peak of AU$111.90/MWh on 19 March, while rooftop solar reached AU$109.58/MWh on the same day, representing a rare convergence in which both segments experienced nearly identical pricing.
Notably, this pricing event coincided precisely with the month’s lowest combined generation output of 85GWh, establishing a clear causal relationship between reduced solar availability and elevated wholesale electricity prices.
Overall, the 24% decline in combined solar generation from January’s peak demonstrates the profound impact of seasonal factors on solar output.
However, the year-on-year growth of 15.9% for utility-scale solar and 9.9% for rooftop solar confirms that capacity expansion continues to drive long-term generation increases even as seasonal cycles impose short-term constraints.
Alongside this, the continued narrowing of the generation gap between utility-scale and rooftop solar suggests a fundamental rebalancing of Australia’s solar generation mix.
Utility-scale installations demonstrated greater resilience during the autumn transition, with their 3.4% month-on-month decline substantially outperforming rooftop solar’s 6.5% decrease.
You can explore previous solar generation performance in our NEM Data Spotlight series, with all entries available to PV Tech Premium subscribers.


