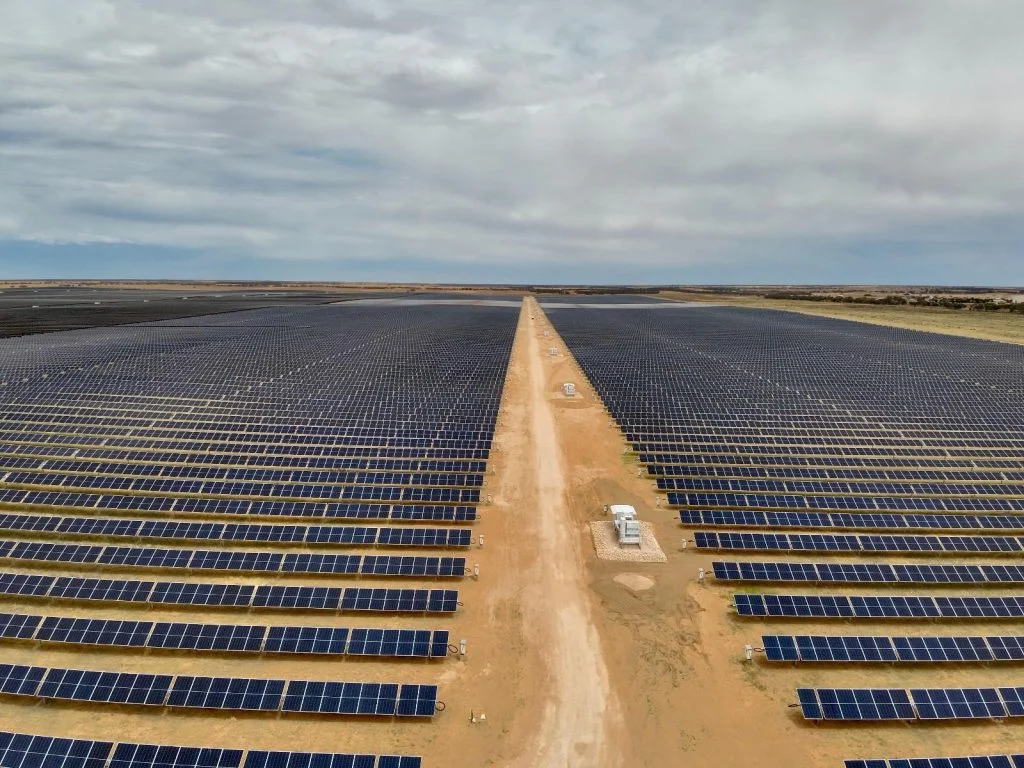
Australia’s National Electricity Market (NEM) recorded a combined 3,893GWh of solar generation in August 2026, comprising 1,628GWh from utility-scale assets and 2,265GWh from rooftop systems.
The combined figure represents a 17.3% increase from July 2026’s 3,320GWh total and a 16.6% rise year-on-year from August 2025’s 3,338GWh. The result extends the recovery that began in July, when combined solar generation rebounded 37% from June’s winter trough, and marks the strongest August in the three-year dataset, surpassing both August 2024’s 2,954GWh and last year’s total.
Try Premium for just $1
- Full premium access for the first month at only $1
- Converts to an annual rate after 30 days unless cancelled
- Cancel anytime during the trial period
Premium Benefits
- Expert industry analysis and interviews
- Digital access to PV Tech Power journal
- Exclusive event discounts
Or get the full Premium subscription right away
Or continue reading this article for free
Analysis of data sourced from Open Electricity (formerly OpenNEM) shows that utility-scale solar at 1,628GWh rose 12.4% from July’s 1,448GWh and was 25.6% above August 2025’s 1,296GWh, the widest year-on-year growth margin recorded for the segment since the winter recovery began.
The total is the highest monthly figure recorded since April 2026’s 1,693GWh, continuing the pattern of steady month-on-month gains that has now persisted since the June trough of 1,092GWh, when combined generation fell 21% amid an end-of-month pricing spike.
Rooftop solar at 2,265GWh climbed 21.0% from July’s 1,872GWh and was 10.9% higher than August 2025’s 2,042GWh.
The total is the highest recorded since April 2026’s 2,163GWh, with the segment now three months into a recovery that followed May’s contraction, when generation fell 21% amid a mid-month pricing spike that reached AU$225.88/MWh.
The narrower year-on-year growth margin for rooftop compared with utility-scale is consistent with the segment’s more mature deployment base, though the underlying trend remains upward across the dataset.
Daily generation dips mid-month before a run of record highs to close August
Daily generation data for August show a pattern broadly consistent with the strengthening trend observed in the second half of July, interrupted by a distinct dip around mid-month, followed by a pronounced rally into the final week.
Output through the first week held relatively steady, with utility-scale generation ranging from 46GWh to 60GWh and rooftop generation from 65GWh to 81GWh.
Conditions then deteriorated sharply on days nine and ten, when utility-scale output fell to 27.3GWh and 28.5GWh respectively, and rooftop generation dropped to 44GWh and 49GWh, the two weakest days of the month for both segments, consistent with a period of overcast conditions moving through the NEM.
Generation recovered through the remainder of the month, with utility-scale output climbing back above 50GWh by day 15 and holding in the 45-62GWh range through the third week, punctuated by a second, shallower dip to 35GWh on day 25.
From day 26 onwards, output strengthened consistently into month-end, with the final week producing the four highest utility-scale readings of August: 61GWh, 73GWh, 69GWh, 66GWh, 66GWh and 73GWh across days 26 to 31, with days 27 and 31 tied for the month’s peak.
Rooftop generation followed the same trajectory, closing the month with its four strongest days in succession, from 89GWh on day 28 to 98GWh on day 31, the highest single-day rooftop total recorded across the month.
The closing-week strength in both segments points to the same lengthening-day dynamic flagged in the July Spotlight, in which improving solar resource through late winter and into early spring compounds with the continued addition of utility-scale and rooftop capacity across the NEM.
Negative pricing returns as August ends the winter demand pattern
Pricing across August was generally more subdued than the volatility recorded earlier in the year, though it lacked the sustained mid-month calm that characterised July.
Utility-scale prices averaged approximately AU$34.90/MWh (US$24.55/MWh) across the month on a simple daily basis, with rooftop averaging around AU$31.70/MWh, both below the elevated levels recorded during May’s mid-month spike and the sustained above-AU$100/MWh run recorded across the final week of June.
The highest pricing of the month came on the sixth, when utility-scale averaged AU$75.27/MWh against a comparatively subdued 46GWh of generation, and on days 25 and 26, when utility-scale prices reached AU$73.62/MWh and AU$65.19/MWh respectively, coinciding with the month’s second generation dip.
Rooftop prices on day 26 reached AU$67.53/MWh, extending a period in which reduced output across both segments supported firmer pricing.
The lowest pricing of the month occurred on day two, when utility-scale averaged AU$11.88/MWh and rooftop recorded a negative average of AU$0.67/MWh, the first negative pricing event of the winter dataset and a reversal of the pattern noted in the July Spotlight, which found negative pricing absent for the month and anticipated its return “from August onwards as solar resource improves and the risk of midday surpluses returns to the generation profile.”
Day 30 recorded the second-lowest pricing of the month, with utility-scale averaging AU$7.36/MWh and rooftop AU$2.18/MWh, despite that day ranking among the strongest for generation in both segments.
Unlike the pattern observed through much of the June and July datasets, in which rooftop solar frequently commanded a premium over utility-scale pricing during periods of grid stress, August saw utility-scale average prices exceed rooftop on the majority of days, with rooftop trading at a discount on 22 of the month’s 31 days.
The reversal is consistent with rooftop’s generation profile becoming increasingly concentrated around midday as daylight hours lengthen, a period in which oversupply conditions typically depress prices for all technologies but affect rooftop’s generation-weighted average more directly, given its narrower generation window relative to utility-scale assets.
The broader pricing environment across August continues to reflect the dynamic described in the Australian Energy Regulator’s recent finding that renewables growth is easing pressure in the NEM, with increasing solar and battery storage capacity moderating the scarcity-driven price spikes that characterised earlier points in the dataset, even as isolated periods of reduced generation continue to produce short-lived pricing peaks.
You can explore previous solar generation performance in our NEM Data Spotlight series, with all entries available to PV Tech Premium subscribers.