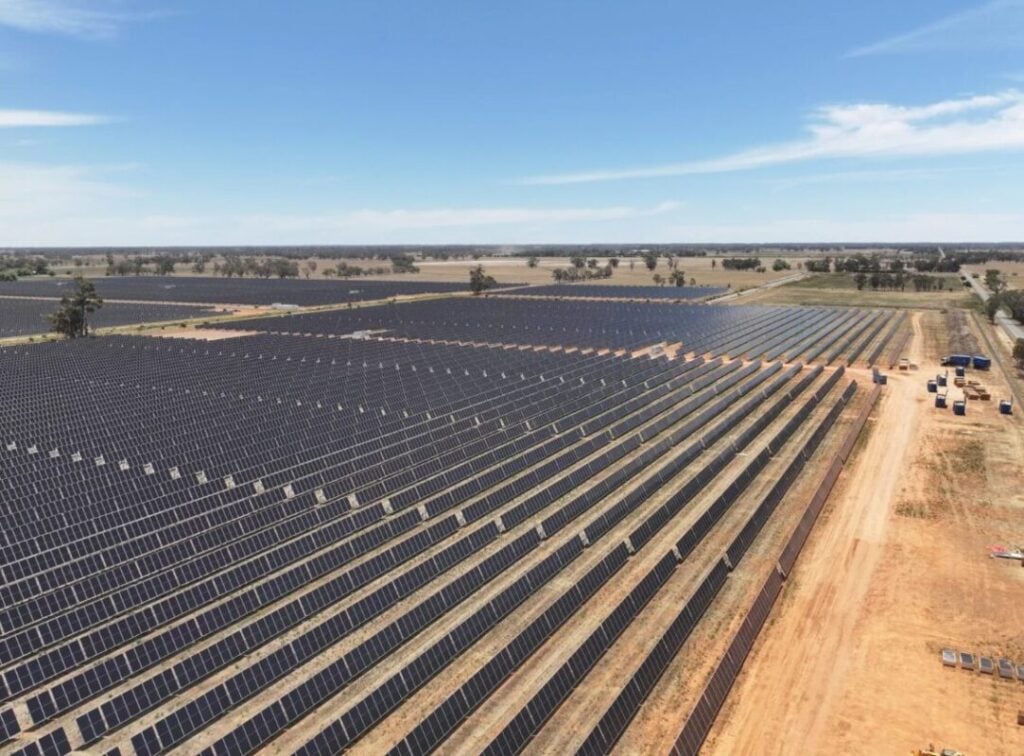
Australia’s National Electricity Market (NEM) recorded a combined 3,320GWh of solar generation in July 2026, comprising 1,448GWh from utility-scale assets and 1,872GWh from rooftop systems.
The combined figure represents a 37.4% increase from June 2026’s 2,413GWh total and a 21.8% rise year-on-year from July 2025’s 2,735GWh.
Try Premium for just $1
- Full premium access for the first month at only $1
- Converts to an annual rate after 30 days unless cancelled
- Cancel anytime during the trial period
Premium Benefits
- Expert industry analysis and interviews
- Digital access to PV Tech Power journal
- Exclusive event discounts
Or get the full Premium subscription right away
Or continue reading this article for free
Analysis of data sourced from Open Electricity (formerly OpenNEM) shows that the month-on-month recovery is consistent with the seasonal pattern observed across the dataset, in which generation climbs steadily from the June winter trough as day length begins to extend into the second half of July.
The July result breaks a six-month sequence of month-on-month declines that ran from December 2025’s combined peak of 5,701GWh through to June 2026’s 2,413GWh, a 58% reduction over that period, as reported in last month’s NEM Data Spotlight.
Utility-scale solar at 1,448GWh was the highest monthly figure recorded since April 2026’s 1,693GWh, representing a 32.6% increase from June’s 1,092GWh. The year-on-year comparison is particularly strong, with July 2026’s utility-scale total 27.5% above July 2025’s 1,136GWh, the widest year-on-year growth margin recorded in the dataset across winter months.
This shows the substantial volume of large-scale capacity that has entered service across the intervening twelve months, with Australia adding 9.1GW of new generation and storage to full output in FY26, with battery storage dominating but utility-scale solar also contributing materially to the total.
Rooftop solar at 1,872GWh rose 41.7% from June’s 1,321GWh and was 17.1% above July 2025’s 1,599GWh, continuing the upward year-on-year trend that has characterised the rooftop segment across the dataset.
The June 2026 anomaly, in which rooftop generation fell 13.1% year-on-year against a prior-year baseline that was itself a winter low, has not repeated in July, with the segment returning to its more typical pattern of year-on-year growth driven by continued capacity additions at the household and commercial level.
The July totals for both segments are the strongest recorded in any July in the dataset, driven by improving solar resource conditions and the cumulative effect of capacity additions commissioned over the past year.
Daily generation data for July show a clear upward trend throughout the month, punctuated by weather-related variability in the first half.
The opening days were relatively subdued, with utility-scale output of 27.8GWh on day one and 34GWh on day two reflecting overcast conditions across parts of the NEM.
Output then lifted through the first week, reaching 51GWh on day seven before easing back over days eight to 14, with utility-scale figures ranging between 39GWh and 49GWh.
The second half of the month produced a sustained strengthening in output that accelerated toward the end of July.
Day 18 was the first day of the month to record utility-scale generation above 50GWh, at 52GWh, and from day twenty-four onwards output climbed consistently, with the final three days recording the three highest figures of the month: 59GWh on day 30 and 65GWh on day 31.
Day 31’s 65GWh utility-scale total was the highest single-day figure recorded in July in the dataset, reflecting conditions approaching the maximum irradiance available at the NEM’s latitudes in late winter.
Rooftop generation followed a broadly similar trajectory, with the final two days recording 73GWh and 72GWh respectively, the two strongest rooftop days of the month.
The daily profile across July is consistent with the seasonal pattern observed in prior years, in which the second half of winter begins to show the early influence of lengthening days on solar resource availability.
Pricing settles through mid-month before lift in the final days
The pricing data for July shows a month characterised by moderate, broadly stable prices in the middle period, with elevated readings concentrated at the opening and closing of the month.
The first two days recorded utility-scale average prices of AU$76.93/MWh (US$54,11/MWh) and AU$59.89/MWh, respectively, before a sustained compression through days three to five brought averages down to AU$26-32/MWh as generation lifted and demand conditions eased.
Days six and seven saw prices recover to AU$56.44/MWh and AU$71.14/MWh as weather variability reduced output.
The highest pricing in the first half of the month occurred on days seven to 10, with utility-scale averages ranging from AU$71.14/MWh to AU$88.88/MWh. Day eight recorded the highest utility-scale price of the first half at AU$88.88/MWh, while rooftop reached AU$105.13/MWh on the same day.
The AU$16.25/MWh premium rooftop commanded over utility-scale on day eight is consistent with the distributed generation premium observed in June, when rooftop solar commanded materially higher prices than utility-scale assets during periods of grid stress, showcasing the role of rooftop systems in offsetting localised demand peaks during periods of grid constraint.
The middle of the month was the quietest pricing period, with days 11 through 14 recording averages between AU$6.14/MWh and AU$37.14/MWh for utility-scale, the lowest of the month occurring on day 12 at AU$6.14/MWh for utility-scale and AU$1.82/MWh for rooftop.
These figures highlight conditions in which an adequate renewable energy supply was meeting demand across the NEM without requiring significant dispatchable generation to supplement output.
Prices through days 15 to 21 were broadly moderate, ranging from AU$26.13/MWh to AU$69.00/MWh for utility-scale, before a second phase of compression through days 22 to 25 brought averages back below AU$40/MWh as the strengthening generation trend reduced reliance on higher-cost capacity.
The final week saw prices lift as generation continued to improve, but demand also responded to changing weather patterns.
Days 29 to 31 recorded utility-scale averages of AU$20.50/MWh, AU$57.91/MWh and AU$63.58/MWh, respectively, with rooftop prices on day thirty reaching AU$73.18/MWh, above the utility-scale average of AU$57.91/MWh on the same day, extending the pattern of rooftop commanding a premium during late-day demand periods.
The absence of any pricing spike of the severity recorded in May 2026, when a mid-month generation shortfall pushed the NEM average to AU$225.88/MWh on 18 May, or of the sustained above-AU$100/MWh run recorded across the final week of June, suggests that July’s generation recovery was sufficient to prevent the scarcity conditions that had driven those events.
The NEM’s Q2 2026 average wholesale price of AU$74/MWh, its lowest Q2 average since 2020, reflected the same dynamic at a broader scale, with increasing renewable energy generation moderating price outcomes that had previously been susceptible to winter demand spikes.
Negative pricing was absent from the July dataset, consistent with the winter demand pattern, in which heating load through the middle of the day prevents the excess-generation conditions that produce negative pricing events during summer and spring.
That pattern is expected to begin reversing from August onwards as solar resource improves and the risk of midday surpluses returns to the generation profile.
You can explore previous solar generation performance in our NEM Data Spotlight series, with all entries available to PV Tech Premium subscribers.