In recent years PV modules have become weaker as a result of their growing surface area and diminishing frame sizes. Colin Sillerud of CFV Labs reports on what testing has revealed about large-format modules and considers what the industry should do about it.
Over the past five years photovoltaic (PV) modules have increased in area while their structural components, such as glass thickness and frame height, have been reduced. This has led to a dramatic mechanical weakening of PV modules, as shown in both laboratory testing and in-field results obtained by CFV Labs. A PV power plant is only as reliable as its components. The PV module, being the central component of a PV plant, must be mechanically robust enough to endure 20-30 years of environmental stresses.
Unlock unlimited access for 12 whole months of distinctive global analysis
Photovoltaics International is now included.
- Regular insight and analysis of the industry’s biggest developments
- In-depth interviews with the industry’s leading figures
- Unlimited digital access to the PV Tech Power journal catalogue
- Unlimited digital access to the Photovoltaics International journal catalogue
- Access to more than 1,000 technical papers
- Discounts on Solar Media’s portfolio of events, in-person and virtual
From 2018 to 2024, the surface area of PV modules increased by 40-60% (Figure 1) on average. Concurrently, frames were reduced from 40mm in height down to 35mm, 30mm, and in some cases as short as 25mm. Further, most of the glass used in utility-scale modules has changed from 3.2mm with tempering to 2.0mm with heat-strengthening. An important feature of these changes also means that the module glass has an increased effect on the mechanical behaviour of the module relative to the frame.

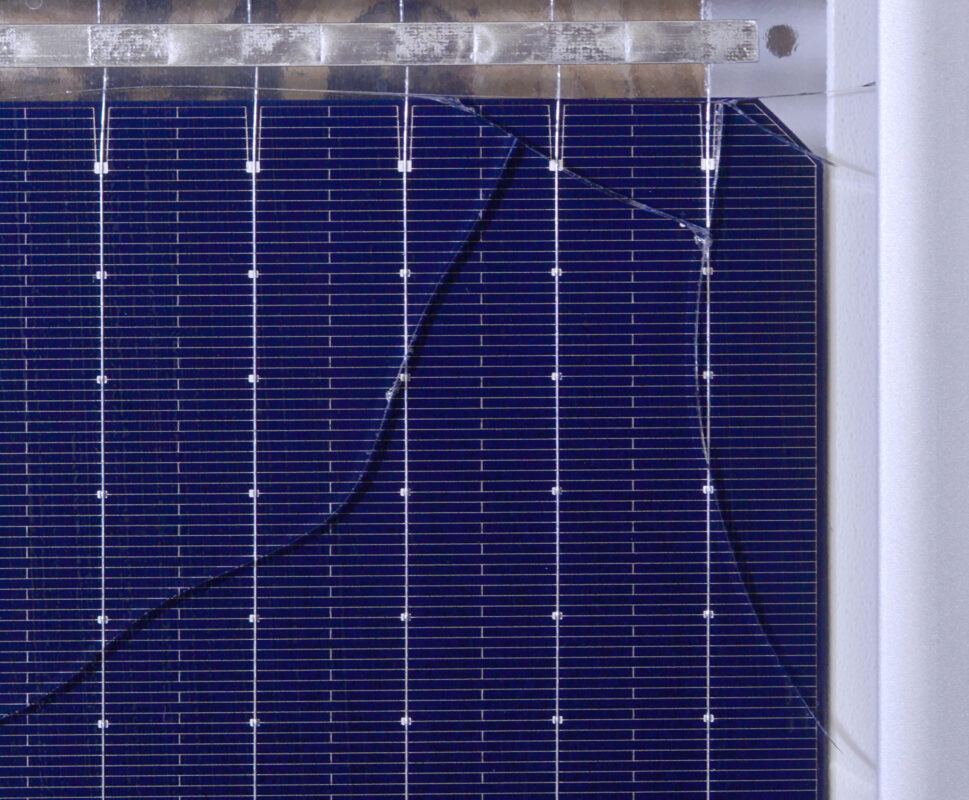
Using glass as the primary load-bearing material can be problematic because it is a low-ductility material and suffers from brittle fracture (Figure 2). When glass is deformed, it either breaks or returns to its original shape. Metal, conversely, is ductile, so it can deform into the plastic regime before breaking. Glass is also inherently more variable because it breaks at existing weak points, called nucleation points, which can increase or decrease with the quality of the surface treatments, such as polishing.

While the PV module has changed, it is important to view it as part of a mechanical system, so it’s not the last word in mechanical strength. Modules require clamps and support structures. Many clamp options exist, including top-clamps and through-bolts, to name a couple. They are typically composed of aluminium or steel. Further, they come in a multitude of sizes and shapes, ranging from 200mm centre clamps to 1,400mm or longer rails. Then the support structures range from single-axis trackers of various heights and dimensions to fixed-tilt systems. Modules can be installed on trackers with a single module in portrait, two modules in portrait, or two modules in landscape.
Mechanical testing
To understand the mechanical properties of PV modules and how they’re qualified, it is important to understand the tests that the industry uses. Mechanical load testing is utilised by the industry to certify and/or qualify modules for different installations and loading conditions. Tests that are widely used today include static mechanical loading (SMLT), cyclic (dynamic) mechanical loading (CMLT), and test-to-failure (TtF).
The SMLT consists of a one-hour hold at a positive (downward), then a negative (upward) test pressure. This is repeated three times. Its goal is to test how a module performs under low frequency, high amplitude events such as snow loading or extreme wind. The CMLT consists of a five-second hold at a positive (downward), then a negative (upward) test pressure, usually +/-1,000 Pa. This is repeated 1,000 times and is designed to examine the module’s response to high-frequency low-amplitude events, such as a lifetime of moderate wind. The TtF consists of a constant ramp, 250 Pa/min for example, until the module either breaks or slips from the securement. TtF is used to gather breakage statistics and to set an upper strength limit for the module/clamp system.
While module manufacturers conduct testing during certification, and they supply installation instructions for a small subset of commonly used installation options, it is not possible for them to qualify every installation possibility ahead of time. As a result, larger PV projects require compatibility testing, which consists of a single SMLT on the site-specific module/clamp/torque tube combination using site-specific design/test loads. The test load is 1.5 times the design load.
However, the test requirements for project compatibility have been reduced over the last five years. Previously a compatibility assessment would require a standard SMLT conducted at ±2,400 Pa, a medium load of +3,600 Pa held for one hour and a snow load of +5,400 Pa held for one hour. Today, only the SMLT is conducted, and it is typically at a pressure below ±2,400 Pa. While testing and module strength were adequate in the past for normal operating conditions, qualitative results from field projects as well as quantitative results from laboratory testing show that they may not be sufficient for current designs.
Modules getting weaker
Laboratory and fielded module test results point to a reduction in PV module mechanical durability. CFV’s results from compatibility testing in Figure 3, show an increase in the failure rate of these projects from 0% in 2018 and earlier to about 30% over the last three years. This means that module/clamp pairs that are being used in project designs are not able to withstand the site-specific pressures that current industry wisdom would expect them to.

Concurrently, the average test pressure has dropped from nearly 2,400 Pa to about 1,500 Pa, which may mean that the industry better understands actual site pressures. Or it may mean that site pressure estimates have been reduced to accommodate project approval. Either way, module failures have increased even as expectations have decreased.
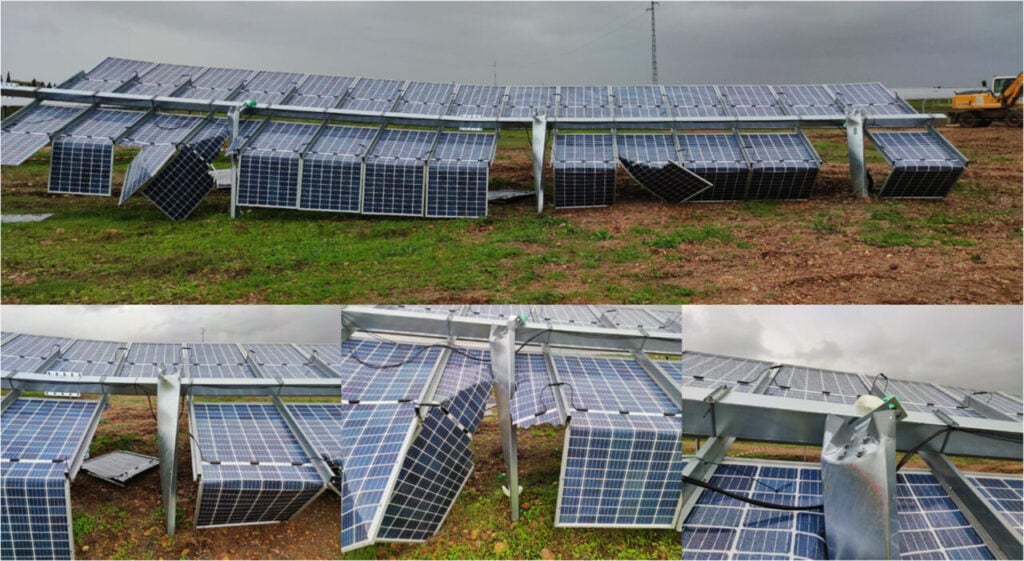
CFV also manages projects related to various failures of fielded modules. CFV’s project bookings related to mechanical failures in fielded modules are up over 300% for the same time frame. These failures can be broken into two categories based on the type of damage—stress cracking (Figure 4a) and catastrophic breakage (Figure 4b). Stress cracking manifests as a single or a few discrete cracks running through either or both the module’s front and rear glass sheets. Considering the projects that CFV has worked on, these can form early, sometimes before commissioning, and don’t correspond to an obvious high-stress event. They are hard to detect and usually don’t affect module power output in the short term. However, they can lead to insulation failures, which can put entire strings out of service and present a major safety risk.
Conversely, catastrophic breakage occurs when significant portions of a PV module’s glass is shattered, which usually corresponds with a high-stress event, such as high winds or impacts from hail or rocks. However, CFV has seen this type of damage even when meteorological data for a plant was within the design range. It is assumed that modules that are susceptible to stress cracks are also more susceptible to catastrophic failure, but this is currently anecdotal.

To validate our lab and field results, CFV conducted a dedicated test-to-failure experiment comparing modules from the past five years. The experiment was built to answer the following questions:
- Are modules mechanically weaker today than they were five years ago?
- What is the module breakage distribution shape and standard deviation?
- Is the breakage distribution, or degree of variation, module size dependent/independent?
- Is the breakage distribution clamp size dependent/independent?
- Can we use test-to-failure to inform SMLT pressures?
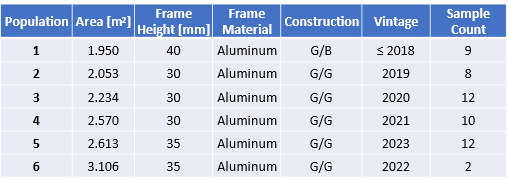
To answer these questions, CFV utilised a test-to-failure approach. We sampled six module types, as shown in Figure 5. All modules were installed on an industry-standard single-axis tracker torque tube using industry standard 400mm centre clamps. Using our pneumatic test stand, pressure was applied in the downward direction to the front side of the modules at a rate of 250 Pa/min until the module failed mechanically, which we defined as glass breakage.
Our results show that modules have become at least 50-70% weaker since 2018. Further, module strength is dependent on size and frame height. As the module area increases, its TtF pressure drops. Likewise, as the module frame height drops, so does the TtF pressure. Figure 6 shows the breakage pressure for each sample set.
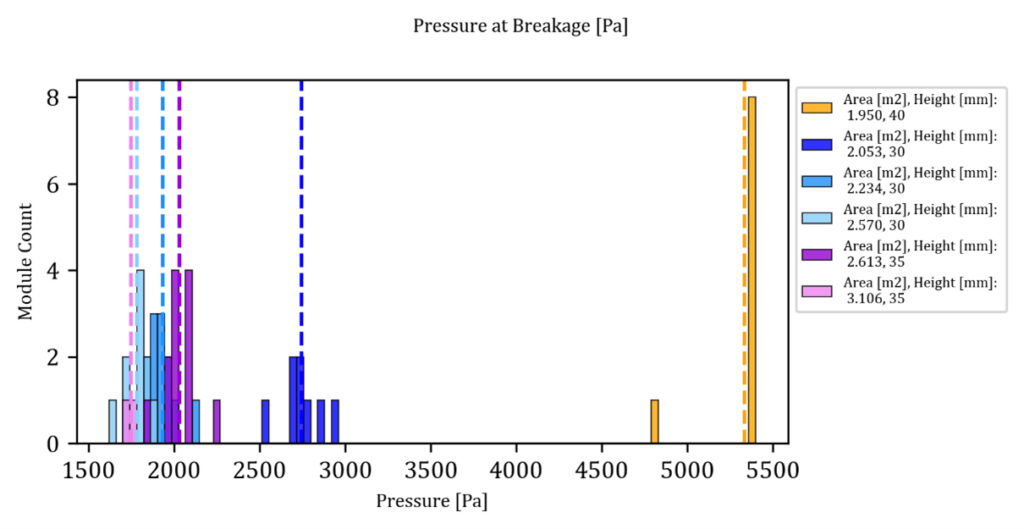
While examining the results, note that eight of the nine data points for Population 1 (1.950m2, 40mm) that reached 5,400 Pa did not fail. The modules in this group reached a test pressure of +5,400 Pa and held that value for one hour. As a result, the true TtF value for this population is not yet documented, but it is greater than 5,400 Pa. For the purposes of this analysis, a TtF pressure of 5,400 Pa will be used.
Comparing Population 1 to Population 2, by reducing the frame height from 40mm to 30mm and by changing from glass/backsheet to glass/glass construction, the TtF pressure was reduced by 48.5%. Comparing Population 2 to 3, an increase in module size of 8.9% further decreased the TtF pressure by 15.2% for a total drop of 63.7% below Population 1.
Figure 7 zooms in on the left side of the plot to examine the larger modern modules. If the module area is held constant around 2.6m2, increasing the frame height from 30 to 35mm increased the TtF pressure by 4.7%, as shown by comparing Population 4 and 5. However, increasing size with the constant 35mm frame height still leads to a drop in TtF pressure, as shown by comparing Population 6 to 5. Specifically, Population 6, with the largest area of 3.106 m2, had the lowest TtF pressure, 5.3% below Population 5 and 67.2% below the benchmark, Population 1.
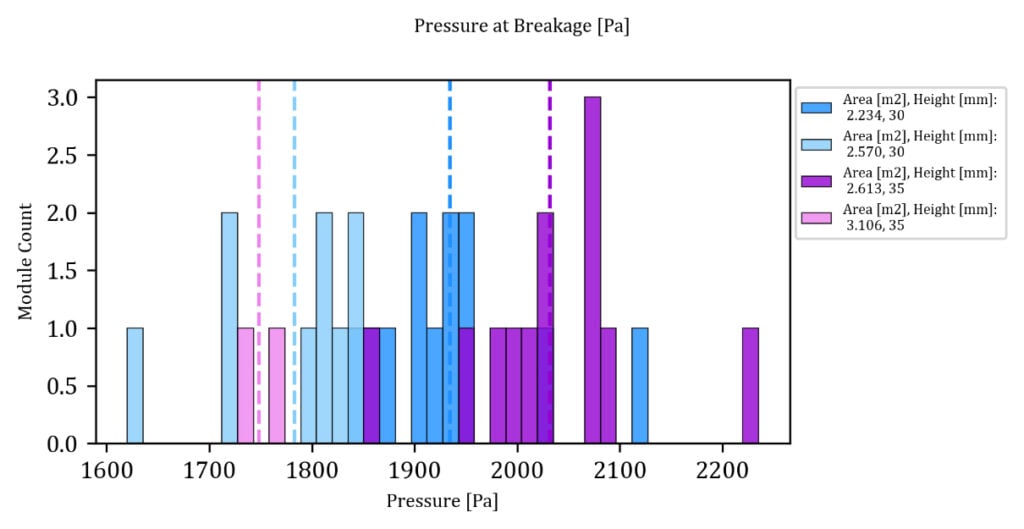
The degree of variation, or the likelihood that a single module represents the population, for this test population, was independent of the module size. The degree of variation, for a given sample population, is a function of the coefficient of variation, or the standard deviation divided by the mean. A value of 4.3 +/-0.2 was measured for the sample Populations 2, 3, 4, and 5 when using a 400 mm centre clamp, which showed that the populations were similarly dispersed about the mean. These populations were chosen because they had large enough sample counts to extract basic statistics, and they broke during testing, unlike Population 1.
This is a useful value, because it shows what to expect from an average glass/ glass module with a 30-35mm frame, an area of 2.0-3.2 m2, and a 400mm centre clamp. If a sample set is tested that falls outside of this range, it may warrant further investigation or planning.
Conversely, the degree of variation in the breakage distribution was dependent on the clamping size. The smaller the clamp, the larger the degree of variation, as shown in Figure 8, so the less likely it is that a single test will be representative of the mechanical strength of the population. The larger the clamp, the smaller the distribution, so fewer modules may require testing to provide a representative result.

One possible explanation is that the clamp size can change the module’s deflection profile. Figure 9 shows the deflection profiles for the same module type tested using 400 or 600mm centre clamps. Clearly, the way the module deforms under load is a function of the clamp width, which may contribute to the increased degree of variation.

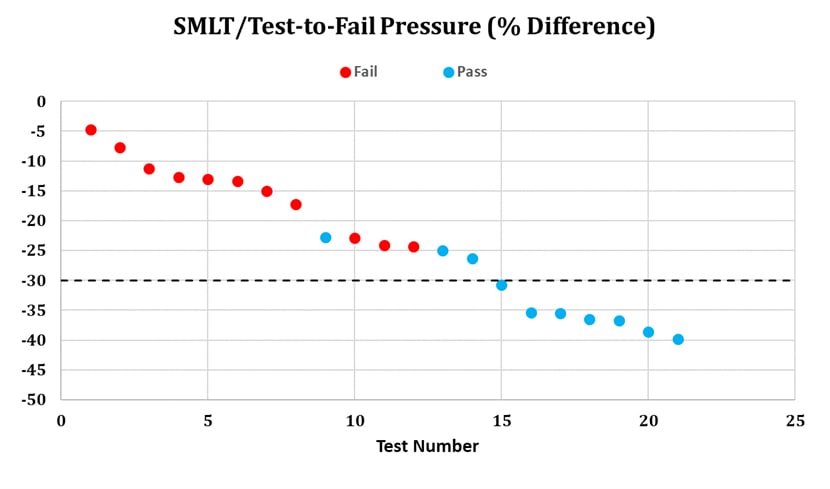
Finally, the test-to-failure results for this sample set were able to predict a passing SMLT pressure. The TtF values were divided by the SMLT pressures on the same modules to calculate a percent difference that can inform a passing SMLT pressure. As shown in Figure 10, a consistent passing result for 400mm centre clamps was achieved when using an SMLT pressure that was 30% below the measured TtF pressure. In other words, if an interested party is uncertain about the strength of their system based on the result of a single test, they can run a TtF regime. CFV recommends testing three modules to failure, then using that result to conduct an SMLT to validate the test and design loads that are achievable with a given module/clamp combination.
Questions for the industry
These results raise many questions for the PV industry. Firstly, is module mechanical durability an issue that actually needs to be addressed? Most commodities have a certain failure rate resulting from the cost/quality optimisation curve. As PV modules have become mechanically weaker from 2018 to 2023, their cost per watt has also dropped by approximately 21%. Is a measurable failure rate acceptable to achieve a lower module cost/watt? While CFV and the author don’t take a stance on this question, we feel it is important for the industry to consider it.
Secondly, can this be solved with existing methods? We showed that increasing the clamp size for a given module will decrease the degree of variation. Anecdotally, it also increases the TtF pressure. CFV is analysing its data to calculate how much pressure increase this can achieve, but that analysis is ongoing.
Thirdly, is the 1.5 safety factor sufficient for modern modules? While it is clear that 2018 vintage modules were over-built with respect to the 1.5 safety factor, to this author’s knowledge, there are very few examples of them spontaneously breaking in the field under expected operating conditions. Today’s modules appear to be built specifically to meet the 1.5 safety factor, but they are breaking, so is the 1.5 safety factor enough to ensure mechanical stability of fielded modules?
Increasing the safety factor is a catch-all solution that would necessitate the use of larger clamps to meet test loads for a given site load estimate. This solution is simple to implement for new projects, doesn’t require new tests to be designed and doesn’t require new technology. However, change at the standards level might be difficult, in which case, developers would have to implement it themselves, which may increase the cost of their bids outside of the industry rate.
Lastly, can this be solved with new methods or technologies? New construction materials, such as steel frames, will likely come to market shortly and have shown promising initial results. CFV has tested a small sample set of two PV modules using prototype steel frames. While the results are preliminary, the two glass/glass samples showed a TtF value in the downward direction of approximately 4,400 Pa, which was an increase in TtF pressure of 113% over the nearest similarly sized and constructed module with an aluminium frame that we tested.
In conclusion, utility-scale modules have got weaker between 2018 and 2023. Increased failures have been reported in test results and in field-related projects. Experimental test results concur, showing a decrease in TtF pressure of at least 50-70% for modern modules as compared to modules manufactured in 2018 and earlier. The degree of variation, or the likelihood that a single module represents the population, is not a function of module size, but it is a function of clamp size. When using thinner clamps, a single module is less representative of the population, which is important to keep in mind when analysing test results. As the stability of the mount is increased, the degree of variation drops, increasing the likelihood that a single module represents the population. Lastly, TtF can be used to inform the maximum SMLT pressure that a module can pass, which can be used to determine independent maximum test and design loads.
While unanticipated module glass breakage is occurring in today’s PV modules, it is important to note that solutions like larger clamps do exist using today’s resources, and it is likely that newer materials may also provide a solution.
Colin Sillerud is the VP of engineering and head of reliability testing at CFV Labs in Albuquerque, NM. He has both collaborated on and designed IEC test protocols and published research on photovoltaic module mechanical and backsheet durability. Most recently, he spoke at the PV Reliability Workshop on changes in the mechanical durability of PV modules. He is also active on multiple standards committees such as IEC TS 63209-1, Extended Reliability Testing.

