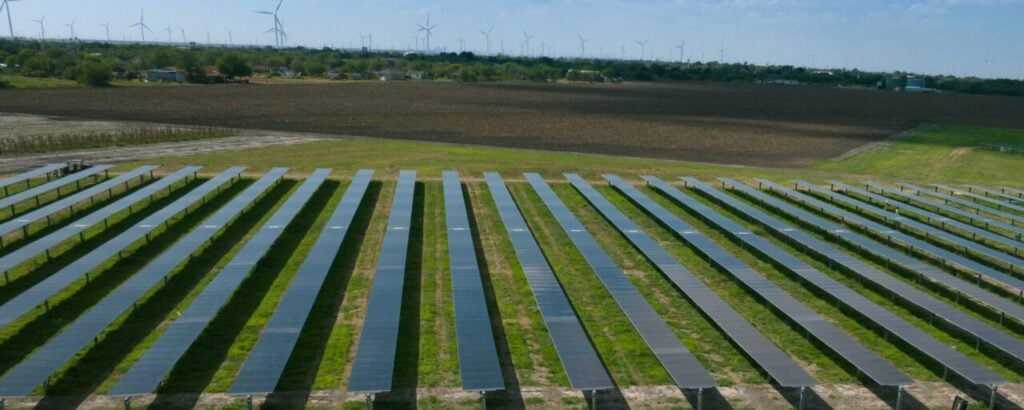
Asset underperformance cost the global solar sector a record US$10 billion in lost revenue in 2024, according to the latest figures from Raptor Maps.
The company deploys software and robotics to improve solar asset management – as a result it collects a lot of data on the solar industry’s performance – and the latest edition of its ‘Global Solar Report’ highlights a 15% year-on-year increase in asset underperformance in the global solar sector.
Unlock unlimited access for 12 whole months of distinctive global analysis
Photovoltaics International is now included.
- Regular insight and analysis of the industry’s biggest developments
- In-depth interviews with the industry’s leading figures
- Unlimited digital access to the PV Tech Power journal catalogue
- Unlimited digital access to the Photovoltaics International journal catalogue
- Access to more than 1,000 technical papers
- Discounts on Solar Media’s portfolio of events, in-person and virtual
While the rate of growth in year-on-year underperformance has slowed from last year, lost revenue due to asset performance has increased 214% over the past five years, with the average system power loss increasing from 1.84% of total project capacity to 5.77% between 2020 and 2024.
The report notes that faults with inverters were the greatest source of power loss in 2024, as was the case in 2023, with inverters responsible for 37% of observed power loss, as shown in the chart above. However, string and combiner faults saw a 19% and 22% year-on-year increase in responsibility for power loss, suggesting that while inverters remain the primary challenge for minimising underperformance, other components are becoming increasingly important.
This is particularly significant in the commercial and industrial (C&I) sector, with Raptor Maps noting that, for C&I sites with a capacity of less than 5MW, there were an average of 264 “identified DC health issues” per megawatt of capacity per year. Tackling these underperformance issues could be particularly challenging as such portfolios tend to be spread out over a number of locations, making it more challenging to execute reactive maintenance in a timely fashion, which then makes them more vulnerable to “higher magnitude events” such as fires and outages.
The report also notes that physical damage to modules has become an increasingly common anomaly, with damage responsible for half of module-level power loss anomalies in 2024, up from just 17% the year prior. This compares to cell defects, which saw its contribution to power loss anomalies fall from 37% to 30% year-on-year as it was replaced as the leading cause of module-level power loss anomalies.
Weather-related risks grow
This reflects a growing sentiment in the solar industry that the sector is unprepared for physical damage from extreme weather events, such as hailstorms. Last month, John Sedgwick, CEO of VDE Americas, said that the US is “dramatically underprepared” for hailstorms, and with both individual modules and solar projects as a whole growing larger, and taking up more space, there is a greater risk than ever of hailstones and other objects falling on and damaging solar equipment.
Raptor Maps, for instance, suggests that industry models estimate the effects of weather-related events on solar projects by at least 300+%, and notes that “storm-prone” markets, such as the Electric Reliability Council of Texas (ERCOT) are more likely to see modules damaged by extreme weather events. This trend is shown in the graph below.
The report goes on to suggest that while extensive damage from hailstorms is “not guaranteed” in the long-term, these trends may continue as the effects of climate change worsen.
Raptor Maps draws on a report titled ‘Hailstone Size Dichotomy in a Warming Climate’, which suggests that the smallest hailstones are expected to fall 25% less often, while the largest hailstones are likely to fall 25-75% more often, and these larger objects pose a greater threat to the safety of solar equipment.
According to the Raptor Maps report, Texas posted the fifth-highest loss per megawatt of solar capacity installed in 2024. Kentucky led the country, with around US$10,000/MW in losses, while Florida – one of the leading solar PV states – posted the fourth-most losses per megawatt. However, California, which has long led the US solar industry, posted lower-than-average losses per megawatt, with its 49.8GW of operational capacity experiencing an asset underperformance of less than 6%.
Labour and political constraints
The Raptor Maps report also notes that a lack of employees, in the operations and maintenance (O&M) sector specifically, is a trend to track. According to data from the US IREC Jobs Census, Wood Mackenzie and the Solar Energy Industries Association, installed US solar capacity has grown by 182% in the last five years, while operational labour has grown by just 91%.
Indeed, 27% of new hires in operations and maintenance in 2024 were due to churn, the replacement of workers who left their positions, showing that over one-quarter of new hires in the O&M sector did not actually increase the number of O&M workers currently operating in the US.
The remainder of new hires in O&M were split between 43% for additional solar responsibilities added to existing positions, and just 29% for completely new positions in solar O&M.
More broadly, the Raptor Maps report suggests that the recent election of Donald Trump to the presidency could “gravitate towards lenient policies for domestic natural gas”, as opposed to renewables, highlighting uncertainty in US solar moving forward.
“While political headwinds, such as tariffs and changing energy policy, bring uncertainty to the solar market, the US has well over 200GW of installed solar capacity and is poised to grow by 45% between 2024 and 2026,” a Raptor Maps spokesperson told PV Tech, when asked about impacts of federal policy. “It is imperative that the solar industry drives efficiency through technology and remains focused on the economic fundamentals.”
Raptor Maps’ 2025 report is available here.

