
Solar PV capital expenditure (capex) covering the midstream segments of the industry (c-Si ingot-to-module and thin-film) is now well into its second major upturn in spending, going into 2018, at a time when the industry is just about to move to a new phase in annual deployment levels of greater than 100GW.
This article discusses why this is happening, the companies and technologies driving this change, and what can be expected in 2018 and beyond.
Try Premium for just $1
- Full premium access for the first month at only $1
- Converts to an annual rate after 30 days unless cancelled
- Cancel anytime during the trial period
Premium Benefits
- Expert industry analysis and interviews
- Digital access to PV Tech Power journal
- Exclusive event discounts
Or get the full Premium subscription right away
Or continue reading this article for free
The underlying themes and outcomes will form a key part of the forthcoming PV CellTech 2018 event in Penang, Malaysia on 13-14 March 2018.
Defining the methodology
PV capex is best analysed by removing spending on polysilicon plants, as the capex here operates on fundamentally different timelines and phasing, compared to capex being allocated to the midstream segment covering ingot-to-module spending. In addition, capex for polysilicon plants is more weighted to plant construction, than discrete process tooling.
PV capex covers factory build costs (often partially financed in Asia by autonomous regions or inward investment vehicles), infrastructure design and build out, and (mostly) production equipment tooling. Therefore, PV capex largely defines the total addressable market for PV equipment suppliers, and offers a key metric to assess market-share trends and share-levels.
The data and graphics contained within this article are generated bottom-up by PV-Tech’s in-house market research business unit that gathers the data for use within its portfolio of syndicated and bespoke research products, in addition to guiding the content and production of the PV CellTech and PV ModuleTech events.
PV capex encompasses also new manufacturing capacity and upgrade equipment spending, in addition to routine maintenance and equipment replacement spending.
Understanding the past
We have gone back 10 years to understand some of the historic trends and drivers that offer some perspective on where the industry stands moving into 2018, and that shape some of the factors that can be used to predict how PV capex will trend over the next 3-5 years.
The figure below shows PV capex trends over the period from 2007 to 2017, referenced to the annual revenues recognized by the leading PV equipment supplier of the past decade, Meyer Burger.
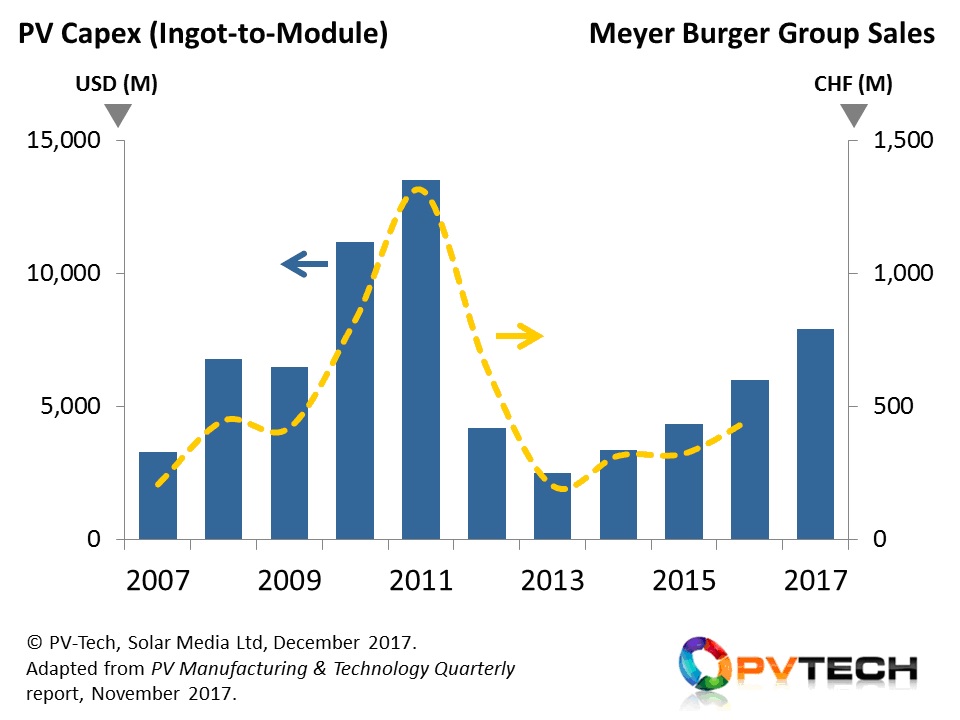
PV capex is going through its second major growth phase, driven by a combination of new capacity expansions, new technology introductions and upgrades to existing installed capacities.
Analysis of PV capex before 2007 is somewhat academic, as spending levels then were minimal. The first real capex cycle for the industry started in the 2007-2009 period, and was driven by a diverse range of issues.
China and Taiwan were then starting their first significant expansion phases for c-Si cell and module capacities, stimulated by demand that was coming from Europe (mostly Spain, Germany and Italy). However, while this was driving huge growth in new order intake from c-Si based tool suppliers, it was thin-film excitement that ultimately drove PV capex levels above USD$10B during 2010 and 2011.
Thin-film market-share gains were being advocated as a done-deal before 2010, and investments of USD$100M at a time were being issued to credible turn-key equipment suppliers, mostly on the back of producing panels that were well below 10% in efficiency. The numbers added up very quickly, and turn-key thin-film production lines quickly had a major influence on overall PV capex levels. Today, none of these lines are in operation.
The spending peak occurred in 2011 and saw literally hundreds of new companies making cells and modules emerge all over China. Each one of these companies saw Europe as a bottomless pit of government subsidy hand-outs that would see crates of Chinese modules shipped in volumes to ports in mainland Europe for years to come.
This didn’t happen. The industry went into chronic overcapacity and oversupply mode, resulting in module pricing collapse. Investor confidence plummeted. Operational losses were widespread. And the result was a collapse in capex in early in 2012.
It took two years for supply and demand to largely get into balance, and this period was all about cost reductions, existing capacity optimization and debottlenecking.
The downturn lasted about two years, and by 2015, green shoots were emerging everywhere with the first signs of technology (not capacity volumes) being the new impetus for the rebound cycle of manufacturing capex.
Technology driven capex rebound
The focus on new technology, both due to upgrades and when incorporated in new fab builds, since 2015 looks very different to the technologies that drove PV equipment spending above $10 billion during 2010 and 2011.
At the c-Si stage, the most obvious change has come from PERC, and by 2019, most of the capacity for both p-type mono and multi will have shifted to include rear passivation deposition, with many of the companies having a clear roadmap to bifaciality. Moving into 2020, this will become mainstream for the industry. Indeed, anyone making c-Si cells with efficiencies below 20% is likely to be left with low-cost selling options then.
However, some of the other key drivers of the current capex rebound are new technology-driven initiatives that have not been seen before, including First Solar’s shift from Series 4 to Series 6 panels and the n-type spending boom that is emerging now in China especially.
It is fair to say that n-type has always seen high levels of interest, with no shortage of roadmaps from major cell producers that tended to be largely wishful thinking. While SunPower and Panasonic largely sat back and watched many n-type start-ups come and go, only Yingli Green and LG Electronics succeeded in having n-type cell capacities in excess of 500 MW that were being operated at mass-production utilization rates.
This all changed about two years ago in China, and the first GW fabs are currently ramping up, with n-type variants spanning n-PERT and heterojunction being the main focus. Regardless of the success rates of these initial movers (many of whom have little if any experience making solar cells until now), what is certain is that we are going to see more investments during 2018 and 2019 with government initiatives in China offering the backdrop for investment security.
In fact, while previous n-type activities in the solar industry were company and R&D lab specific, the China efforts today are more collaborative in nature, or simply less prone to the commercial confidentiality that is the norm for manufacturing outside of China and Taiwan.
Moreover, efforts to use domestic equipment suppliers for n-type tool supply in China further helps to establish (albeit indirectly) an open pool of knowledge that could be shared somewhat freely by other players in China wishing to jump on the n-type bandwagon should it become a competitive threat to p-type mono in coming years.
No sign of Chinese capex slowdown
On so many counts today in the PV industry, not simply for PV capex, there are no obstacles suggesting any imminent cooling in China. The security of a 50GW-plus domestic end-market exclusive to Chinese-produced ingots/wafers/cells/modules is unprecedented, and the fact that we see new technology-driven initiatives now for n-type differentiation should not come as any great surprise.
Investments in a few gigawatts here and there for new n-type projects may seem like reckless extravagance to most outside China struggling to make the numbers balance monthly on established GW-level fabs, but within China this is almost the new norm, and not entirely out of context if one regards the entire c-Si capacity in China as a single integrated manufacturing unit.
The graphic below spells out just how important equipment spending on new capacity and technologies within China has been to the capex rebound since 2015. Remove this contribution, and we are back essentially at 2012 levels.
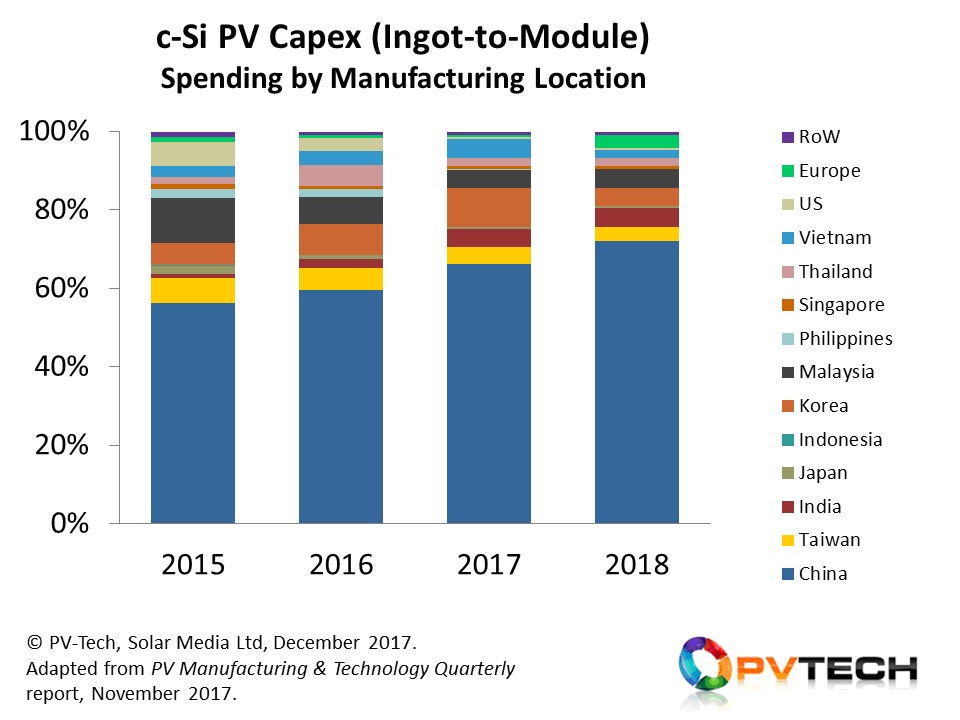
Equipment spending across the c-Si ingot-to-module value-chain has been stimulated by domestic manufacturing within China, with 2017 and 2018 contributions seeing new efforts to scale up n-type GW fabs.
PV CellTech 2018 to address the competitive threat from n-type activity
Going into its third year, PV CellTech 2018 has been structured to address the threat coming from the new n-type investments, and whether in particular n-PERT and heterojunction can truly offer value-added propositions versus p-mono PERC.
This issue will become one of the key themes for solar manufacturing during 2018-2020, as important as the ‘what-next-after-PERC’ question for p-mono. And behind all of this is cost and wafer supply, not to mention potential wafer thickness reduction possibilities not currently being driven by the p-type community.
Could the threat from a few GW of n-type heterojunction capacity in China, coupled with multi-GW of sub-140 micron n-type wafer supply, be the catalyst that finally drives the entire c-Si industry to make a step-wise silicon material consumption decrease that would make major inroads into the silicon component of blended module costs, and cause havoc with polysilicon expansion plans?
PV CellTech 2018 takes place on 13-14 March 2018, in Penang, Malaysia. The relevance of the event, and in mapping out the real technology trends over the next 12-18 months, is almost definitely set to move to a new level of importance.

")


