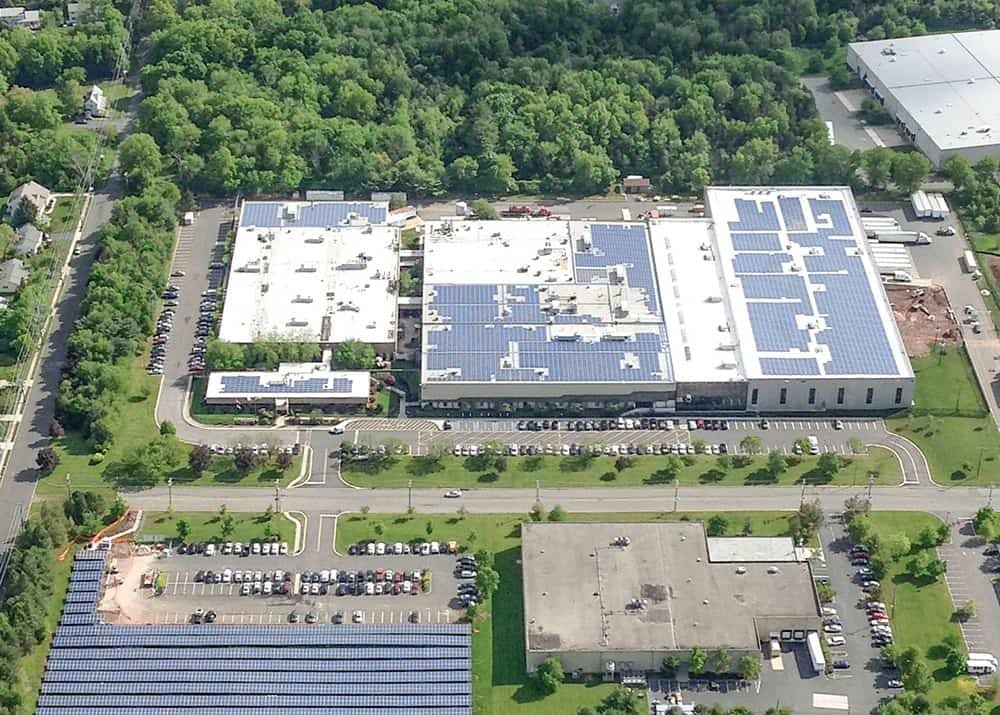
New solar and energy storage projects accounted for 84% of all electricity generating capacity added to the US grid in 2024, with solar alone seeing 50GW of new capacity additions.
These are the headline figures from the ‘US Solar Market Insight 2024 Year in Review’ report, published today by the Solar Energy Industries Association (SEIA) and Wood Mackenzie. The 50GW of new solar additions is a 21% year-on-year increase over the capacity added in 2023, and marks the second consecutive year of record-breaking solar capacity additions. These additions are also the greatest single-year capacity additions for a single technology in more than two decades.
Unlock unlimited access for 12 whole months of distinctive global analysis
Photovoltaics International is now included.
- Regular insight and analysis of the industry’s biggest developments
- In-depth interviews with the industry’s leading figures
- Unlimited digital access to the PV Tech Power journal catalogue
- Unlimited digital access to the Photovoltaics International journal catalogue
- Access to more than 1,000 technical papers
- Discounts on Solar Media’s portfolio of events, in-person and virtual
“Solar and storage can be built faster and more affordably than any other technology, ensuring the US has the power needed to compete in the global economy and meet rising electricity demand,” said SEIA president and CEO Abigail Ross Hopper, whose comments, and the report’s conclusions more broadly, echo similar sentiments expressed by the Business Council for Sustainable Energy (BCSE) and Bloomberg New Energy Finance (BNEF), which published their end-of-year report last month.
This report focused on the falling levelised cost of electricity (LCOE) associated with solar, and found that the US added 49GW of new capacity in 2024. While the two reports differ slightly on the exact capacity added in 2024, the general sentiment remains the same.
The graph above, using figures from SEIA and Wood Mackenzie, shows quarterly capacity additions by sector in the solar industry, with utility-scale additions in the fourth quarter of 2024 making a significant contribution. In fact, the utility-scale sector alone added more capacity in the fourth quarter of 2024 than all sectors added to the grid in any full year prior to 2020.
However, the distributed sectors also saw significant capacity additions in the final quarter of the year, with developers adding more residential, commercial and community solar capacity to the grid than in the previous quarter. According to the SEIA and Wood Mackenzie figures, the fourth quarter of 2024 saw record additions for the commercial and community solar sectors.
In total, the US added 4.7GW of residential solar in 2024, 2.1GW of commercial solar and 1.7GW of community solar. While residential additions fell 32% year-on-year – which the report attributes to company bankruptcies, high interest rates and uncertainties in the leadup to the 2024 presidential election – the commercial and community solar sectors saw 8% and 35% year-on-year growth in capacity additions, respectively.
Texas remains number one for new additions
The report also notes that there is significant regional variation in capacity installations. While the three leading states – Texas, California and Florida – have occupied the top three positions in annual capacity additions since 2022, Texas continued its exponential growth in 2024. Between 2022 and 2024, the state’s annual capacity additions jumped from 4,898MW to 11,728MW and finally to 11,627MW, more than double the 4,961MW of new capacity added in California in 2024.
Florida, meanwhile, added 4,730MW of new capacity in 2024, and was the only one of the big three to add more capacity in 2024 than in 2023. This marks the third consecutive year of greater capacity additions in Florida, which have increased from 2,067MW in 2022, and while Florida has around one-third of the total cumulative operating solar capacity of California – 17,055MW compared to 49,777MW – the rate of change in these states is notable. These trends are shown in the graph below.
A number of states with smaller solar industries have also benefitted from consistent capacity additions. Ohio, Arkansas, Mississippi and Louisiana saw their ranking in terms of annual PV installations among the 50 states improve from 32nd to 5th, 36th to 8th, 30th to 14th and 38th to 15th, between 2022 and 2024.
All of these states have Republican governors, and the growth of solar capacity additions in conservative states has led some to suggest that the Trump administration will struggle to roll back the country’s push for greater renewable power deployments. However, much of this growth remains highly concentrated, with the report noting that nearly 70% of utility-scale installations in 2024 were concentrated in just seven states: the big three, plus Illinois, Indiana, Ohio and Virginia.
While many of these figures are encouraging for the US solar sector as a whole, the Trump administration looms large over the industry. Some companies sought to purchase more solar products or install more equipment in the last days of the Biden administration, to take advantage of favourable economic conditions created by the Inflation Reduction Act (IRA).
While the general sentiment towards Trump’s solar policies is one of uncertainty, as opposed to outright fear, this is a notable change from the Biden administration, and has inspired a flurry of new project acquisitions and installations. Doug Edwards of installer Exact Solar told Texas Public Radio that his company’s inventory was “packed to the gills” ahead of Trump’s inauguration in January.
Manufacturing capacity grows, but remains imbalanced
A key component of the IRA has been the wave of tax credits offered to companies that locate renewable power manufacturing capacity in the US, as the country looks to reduce its reliance on overseas imports, particularly from China, to meet the growing demand for clean energy products. The SEIA and Wood Mackenzie report notes that US module manufacturing capacity grew 190% year-on-year, reaching 42.1GW by the end of 2024, and increasing to over 50GW in the early months of 2025.
However, upstream components of the manufacturing sector have fared less well, with the report noting that the US boasts just 2GW of crystalline cell manufacturing capacity, in addition to 10.6GW of domestic thin film capacity, courtesy of a First Solar facility.
This heavy emphasis on downstream manufacturing reflects the European solar sector, where three-quarters of European manufacturers focus on products such as modules, rather than cells and wafers, meaning that for all the investments made into Western manufacturing, China remains the dominant force in the global upstream supply chain.
According to figures from the International Energy Agency’s Photovoltaic Power Systems Programme (IEA-PVPS) and trade body SolarPower Europe, China was responsible for 98% of the world’s ingot and wafer manufacturing capacity, and 92% of its polysilicon and cell manufacturing capacity, as of the end of 2023.
Contracting growth
Looking ahead, SEIA and Wood Mackenzie expect growth to contract across the US solar sector, suggesting that the record highs of 2024 are not sustainable, and that the uncertainty stemming from the new administration will dampen appetite for new investments. The report notes that, in the utility-scale sector, the fourth quarter of 2024 saw a 17% year-on-year decline in new capacity additions, and this momentum is expected to continue, with the US utility-scale sector adding less than 40GW of new capacity each year from 2027 to 2035.
There are similar trends for the distributed sectors. The report expects commercial installations to fall by 11% in 2025, while community installations will drop by an average of 8% each year to 2029. Even the residential sector will not grow as much as was once forecast, with the report expecting installations to grow by 9% at the end of 2025, which represents a 16% reduction in earlier forecasts for end-of-2025 capacity additions, and a 15% reduction in five-year outlook.
“Last year’s record-level of installations was aided by several solar policies and credits within the IRA that helped drive interest in the solar market,” said Sylvia Levya Martinez, principal analyst for North America utility-scale solar at Wood Mackenzie.
“We still have many challenges ahead, including unprecedented load growth on the power grid. If many of these policies were eliminated or significantly altered, it would be very detrimental to the industry’s continued growth.”

