With solar operations and maintenance experiencing significant price pressure, adequate fault detection that occurs as quickly as possible has become increasingly important for asset operators. Here, 3E’s Julien Deckx explores early fault detection strategies for solar PV plants.
Utility-scale solar PV O&M costs came down a staggering 85% between 2005 and 2017 (numbers for Europe) [1]. This steep descent is an indication of the immense price pressure that O&M service providers are under. Since manpower is a large part of the cost, the managed capacity per operator is continuously increasing. The growth and consolidation of the market means that portfolios become larger and more geographically spread out.
Try Premium for just $1
- Full premium access for the first month at only $1
- Converts to an annual rate after 30 days unless cancelled
- Cancel anytime during the trial period
Premium Benefits
- Expert industry analysis and interviews
- Digital access to PV Tech Power journal
- Exclusive event discounts
Or get the full Premium subscription right away
Or continue reading this article for free
One of the ways that O&M service providers have been able to cope with this pressure is digitalisation. Smart monitoring platforms allow to identify issues remotely, with less need for plant inspections. However, the evolution to larger, more diverse portfolios with less on-site presence makes it challenging to keep the operation of PV plants at an optimal level. With tight margins in a post-subsidy era, asset owners can no longer afford to lose revenue from avoidable losses.
To get a sense of the potential gains in plant performance, the plants connected to the 3E Asset Operations solution (part of the SynaptiQ digital platform) were analysed. For sampled plants, the average Energy Performance Index, which is computed as defined in IEC-TS 61724-3 [2] was calculated. This method compares the measured energy to the expected energy based on a detailed simulation of a plant, given the measured meteorological data. Energy Performance Index was divided by availability to filter out losses from plant and inverter unavailability. After removal of outliers, average plant performance was estimated at around 97%. At current PPA prices in Europe, around €60/MWh, a 3% loss comes down to about €2,200/MWp/year (figuring a specific yield of 1200 kWh/kWp). This revenue loss is the equivalent of approximately 24% of the total Opex of a utility-scale plant, estimated at US$10,000/MW/year (€9,000/MW/year) [1].
The numbers above suggest that there is still significant progress to be made to improve the performance of solar plants. While digital tools have helped to make the operation and maintenance of PV plants exponentially more efficient and effective, the reduced on-site presence also means that some production losses are left undiscovered for larger periods of time.
Luckily, digital tools are further evolving. A new generation of AI-driven advanced analytics is capable of automatically and continuously providing a detailed breakdown of the root causes of production losses. Based on detailed monitoring data, such system can detect issues in a very early stage. This prevents PV plants from underperforming for large periods of time and increases overall profits.
Case study: inverter temperature derating
A 1MW rooftop plant with known issues was analysed retrospectively. In spring of 2020, PR values suddenly dropped about 10% compared to the year before. After many hours of manual analysis, it was discovered that this problem was due to derating of the inverters because of overheating.
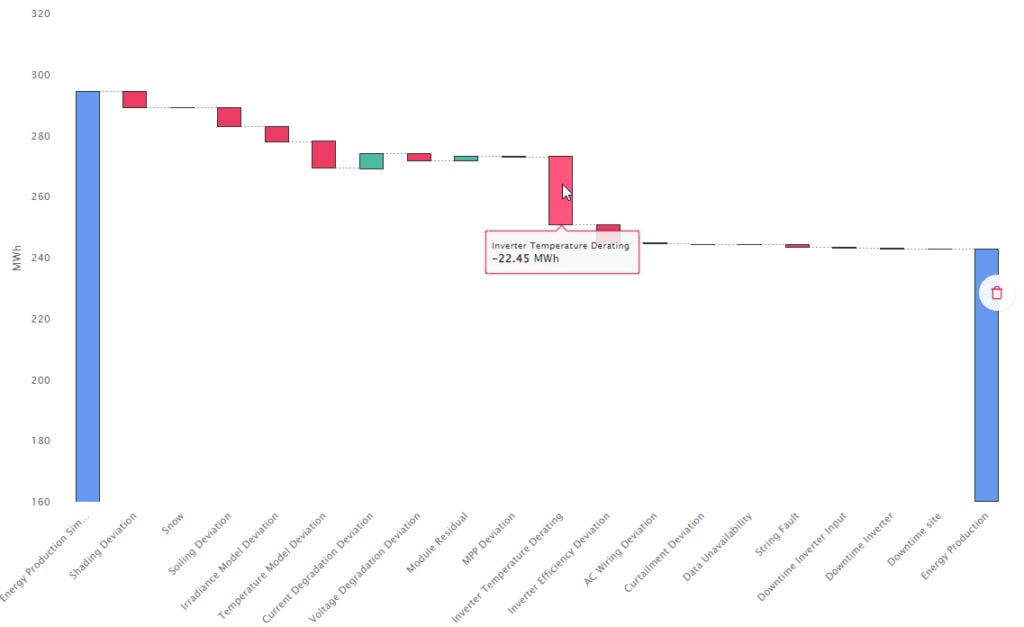
An automated loss breakdown for the period of April-May 2020, generated in 3E Solar Analytics (part of the SynaptiQ digital platform), is shown in Figure 1. The inverter temperature derating is identified by the automatic analysis and is quantified to be about 7.5% of the expected production. Additionally, an exceptionally dry month of April caused a soiling loss, which accounts for another 2% loss over the two months.
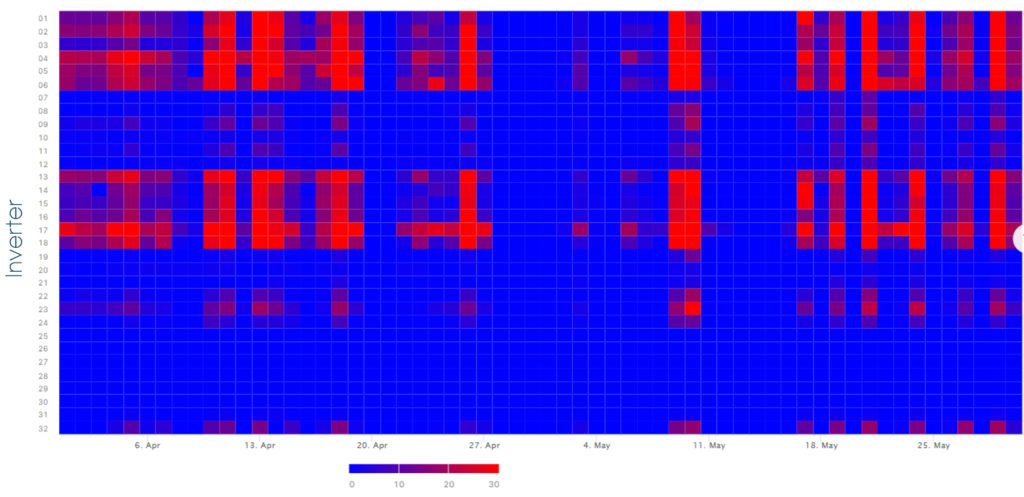
Plotting the derating loss per day and per inverter (Figure 2) reveals that the problem occurred for a subset of the inverters. Indeed, the devices with overheating issues were those at the highest, and thus hottest point in the inverter room.
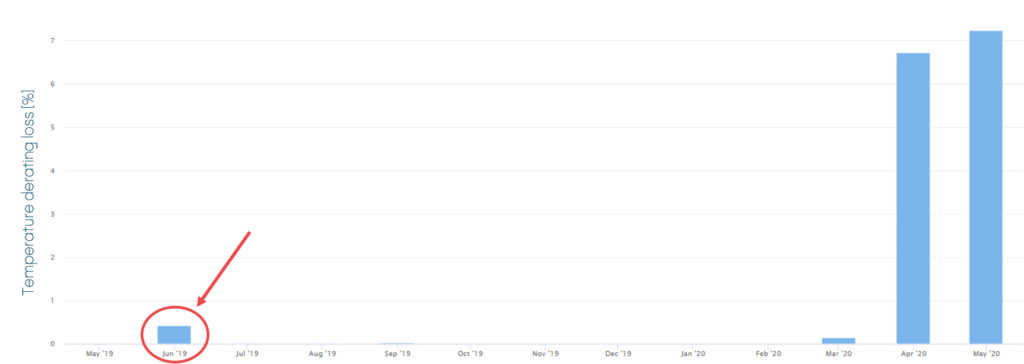
How would this analysis have helped early detection of the problem? Figure 3 shows the inverter temperature derating loss per month for the plant. Temperature derating issues were detected as early as May of 2019, when they caused a 0.43% loss. With 3E Solar Analytics, the plant operator is notified through an alarm. The system warns that inverter losses of up to 20% occurred on certain days. Based on this alarm, the plant operator investigates the issue and improves the ventilation in the inverter room. As a result, the problem is fixed a year before it becomes apparent in the performance metrics, thus avoiding thousands of euros of lost revenue.
Setting a reliable baseline
The early detection of losses, as shown in the example above, requires a reliable baseline. The expected production of the plant should be simulated, including a detailed modelling of inverters and string sets. This is typically done by creating a digital twin, which serves as a model to simulate energy output as a function of meteorological conditions. The reliability of the simulation is dependent on the type of digital twin that is being used:
- Physics-based (aka white-box) modelling: the digital twin is based on the expected physical response of the devices in the plant, derived from the parameters in the datasheets
- Data-driven (aka black-box) modelling: the digital twin is trained to replicate the behaviour of the plant based on historical data, with little to no domain knowledge
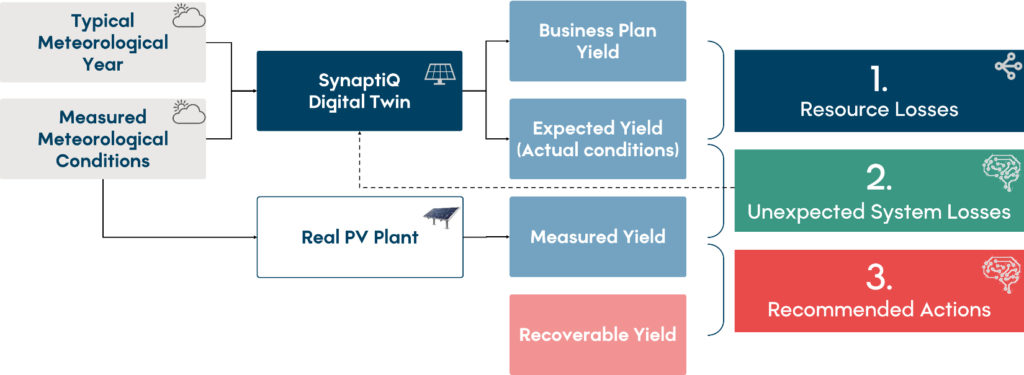
The data-driven approach may be better at predicting the actual performance of a plant, but it will inherit performance losses that occur in the training data. The physics-based approach provides a more deterministic baseline, but some model parameters may not be fully accurate. A hybrid grey-box approach provides the best of both worlds (Figure 4). The physics-based digital twin is used both to simulate business plan yield based on a typical meteorological year, and to recalculate expected yield based on measured meteorological data. The comparison between those two simulations allows to assess resource losses. Machine learning is then used to break down the gap between expected and measured yield into different loss categories, as well as to formulate recommendations to recover lost production.
This approach results in a more detailed and more reliable analysis than a black-box method. An accurate physics-based digital twin includes the datasheets of all devices, as well as the full string configuration. The temporal resolution of the simulation should be 15 minutes or less. Indeed, inverter clipping may occur in sub-hourly intervals – this would be missed if the resolution is too low, leading to an overestimate of the expected performance of the plant.
Unexpected losses consist of model corrections, performance losses and availability losses. The grey-box method gives flexibility in terms of which unexpected losses are fed back to the digital twin to correct the simulation model. This flexible method allows to serve the multiple purposes of simulation:
- Contractual performance assessment: how does the plant perform compared to the initial simulation model (e.g. for EPI calculation)? The digital twin is not altered.
- Technical performance assessment: how does the plant perform compared to the corrected simulation model? Only model corrections are applied.
- Energy forecasting: what energy output is expected from this plant, including performance losses? Both model corrections and performance loss deviations are fed back to the digital twin.
Classification and quantification of performance losses
Performance at plant level, or even at inverter level, is the result of many confounding factors. Issues in one level can thus remain masked by overperformance in other levels. The key to identifying problems early on is to have a sufficiently detailed simulation, combined with equally detailed monitoring data. Concretely, it’s necessary to monitor current and voltage at MPPT level and compare those to simulated current and voltage. This comparison allows to separate MPP tracking issues from other losses at the DC side. Assessing voltage and current degradation separately gives a more in-depth understanding of underperformance at module level.
A few examples of relevant performance losses are given below:
Tracker losses can be identified when monitoring tracker angle and comparing it to the simulation. This type of loss can go undetected for a long time because it can be a very localised failure that doesn’t immediately impact the KPIs on plant level.
Shading losses can be detected as drops in DC current with consistent patterns according to the time of day and the time of the year. New constructions may arise in the vicinity of the plant. It’s important to identify this in time in order to adjust business plans if needed.
Degradation losses can be identified by analysing consistent deviations between MPP current and voltage on the one hand and measured current and voltage on the other hand. Having a split-up between current degradation and voltage degradation is indispensable in order to reach detailed conclusions. For instance, light-induced degradation (LID) and normal annual degradation typically manifest themselves as current degradation. On the other hand, potential-induced degradation (PID) is characterised by voltage degradation combined with current degradation and mismatch losses.
Soiling losses look very similar to current degradation but evolve faster and are characterised by the presence of cleaning events. Indeed, sudden jumps in performance, whether caused by rainfall or by manual cleaning, can be detected automatically. Based on those events, soiling can be separated from the more long-term effects of degradation. Note that some types of soiling may be permanent, especially in the absence of manual cleaning, and, as a result, can no longer be distinguished from current degradation. Known examples include bird droppings and dirt from surrounding trees. Soiling losses may also be quantified by using on-site sensors. In the absence of sensors, and particularly in climates with frequent rainfall, soiling losses may not be apparent in overall performance KPIs. Nearby activity may lead to hidden performance losses. Automatic detection of soiling losses from monitoring data addresses this issue.
Maximum power point (MPP) losses are caused by imperfect tracking of the MPP by the inverter. Losses due to MPP tracking should be carefully separated from specific causes, like inverter temperature derating.
Inverter temperature derating is identified when MPP losses are associated with high inverter temperatures. As seen in the case study above, inverter temperature derating can manifest itself as a marginal problem before significantly affecting the performance of a plant.
String faults can be detected, even without string monitoring, as long as the number of strings per monitored string set is limited. Smart detection of string faults uses the knowledge of the number of connected strings to identify whether a drop of power is caused by the failure of one or more strings. Further intelligence is built in to avoid false positives, e.g. in the presence of shading. Especially in utility-scale plants, string faults can easily go unnoticed. When identified, they are relatively easy to fix, especially if a site visit is scheduled for other maintenance work. Indeed, remediating string faults provides a sure and quick return on the maintenance cost, if and when detected automatically and reliably.
Data verification
An important condition for the accurate identification of performance losses is a thorough assessment of the data being used. The analysis of plant performance is based on three important pillars: the digital twin of the plant, measured production data and the measured meteorological data (irradiation in particular). Automated analysis of the combination of this data allows to identify common errors like incorrect scaling factors, missing DC inputs, incorrect string configuration and time shifts. The irradiation data specifically, if coming from sensors, must be analysed continuously. Advanced comparison of sensor data with satellite data allows to identify issues like offsets, non-linearity, incorrect orientation, and shading. Appropriate actions should be recommended to remediate.
Validation
Incorrect conclusions from automatic production loss classification can lead to unnecessary costs related to onsite inspections and further examinations. Furthermore, in the context of warranty claims, it is crucial to show that losses have been quantified correctly. It is therefore indispensable to validate the correct functioning of such advanced analytics.
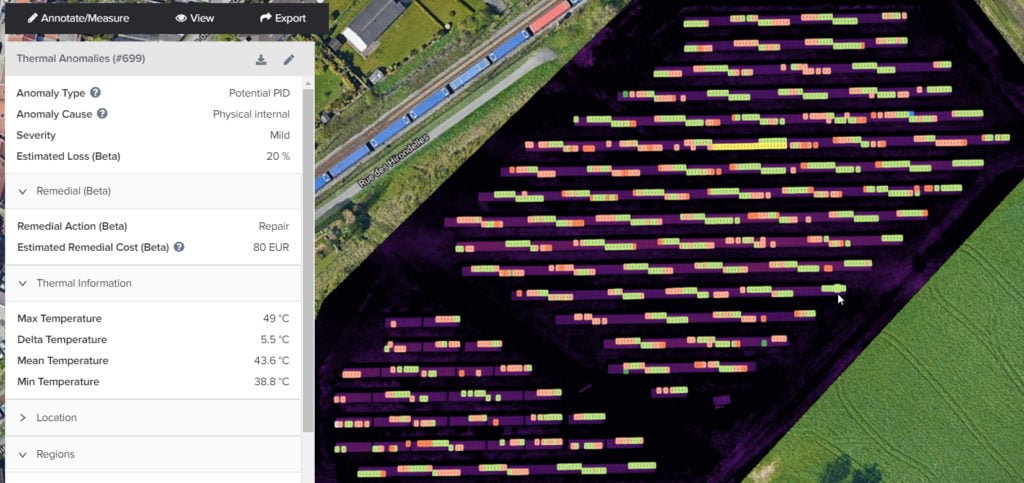
The difficulty that arises when conducting a validation of production loss analysis, is to find a suitable ground truth. In absence of performance losses that are known with 100% certainty, comparison with other methods is a suitable second choice. This is especially true when the other methods provide the diagnosis based on a fully separate set of input data. This is the case for drone inspections, which combine thermal and visual imaging to detect issues in a plant.
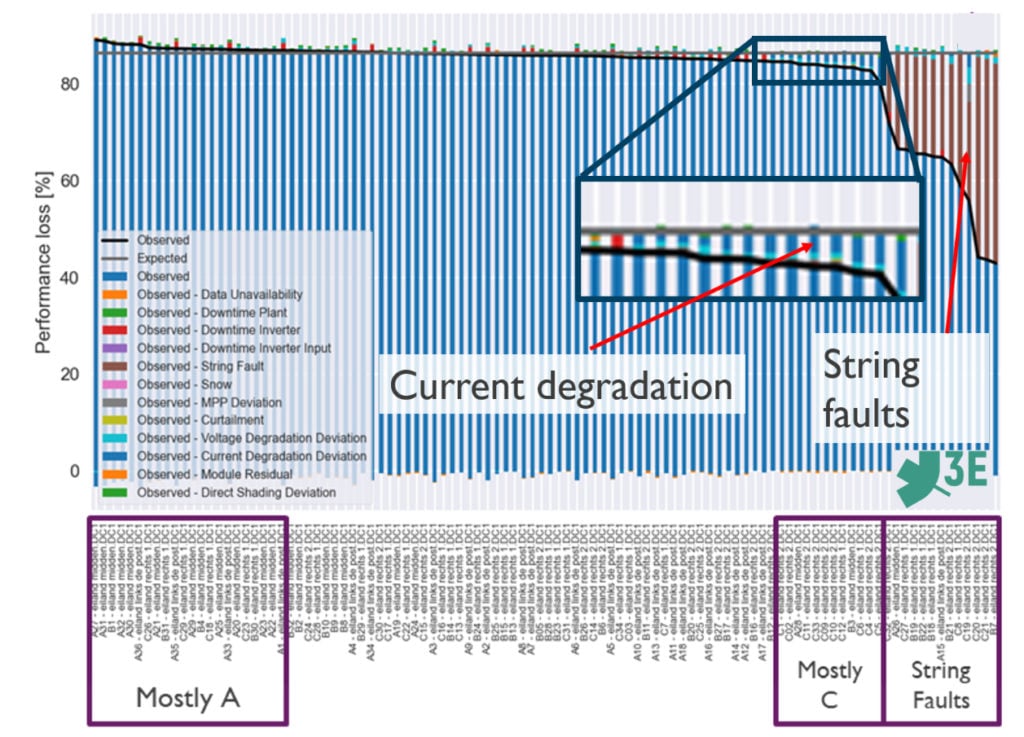
Figure 5 shows a comparison of the automatic loss analysis of a 1.4 MWp rooftop plant with a drone inspection. A total of 16 string faults were discovered by the automated loss analysis, which is 1 more than detected by the drone. In addition, current degradation was detected in those areas where a large number of hotspots was found by the drone. These hotspots are mostly caused by bird droppings, as the site is located in a port area with seagulls. There is a strong correlation between the number of hotspots detected by the drone and the energy loss estimated by the automated loss analysis.
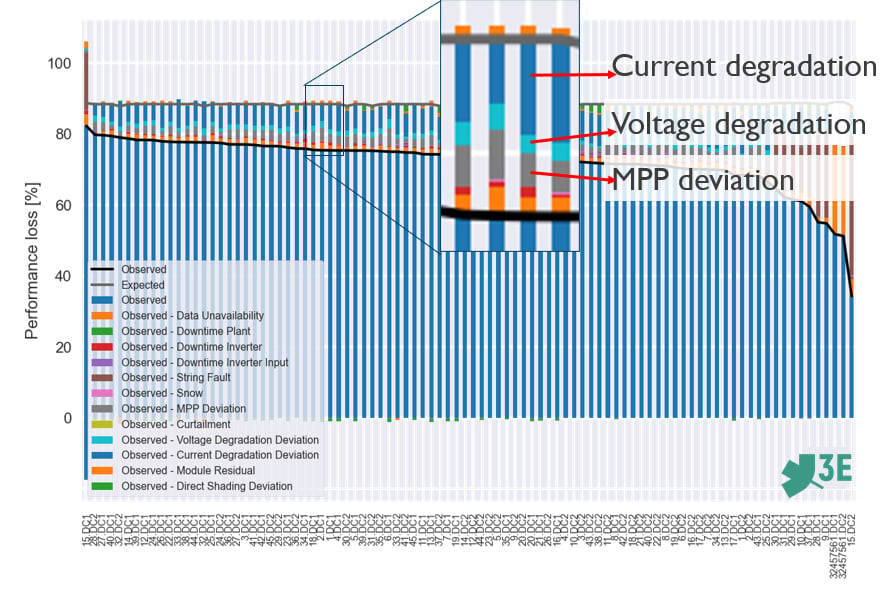
The automatic loss analysis of a 1MW ground-mounted plant was compared with a drone inspection report (Figure 6). The analysis from monitoring data detected a combination of current degradation, voltage degradation and MPP deviation. The smart recommendation engine recognises this combination of losses, where the MPP deviation in fact points to a module mismatch, as potential-induced degradation (PID). The drone inspection confirms this same issue, with a similar estimated performance loss of around 20%.
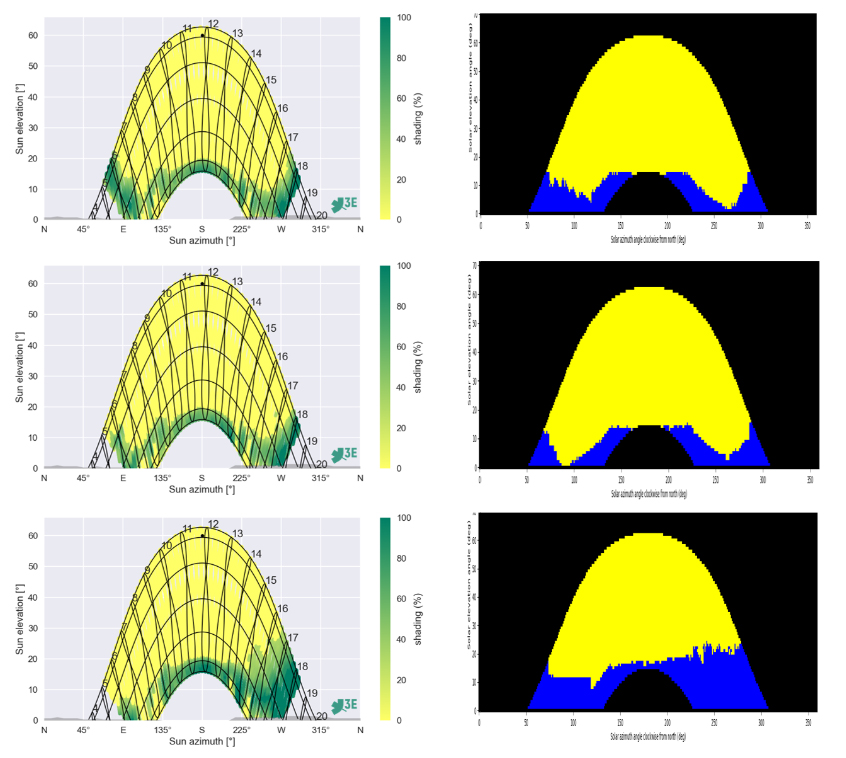
In order to validate the detection of unexpected shading from monitoring data, the digital twin of the plant was altered to remove known shading. As a ground truth, the shading profile of selected locations in the plant was calculated from a 3D drone scan of the plant and surroundings. The shading maps calculated by the advanced analytics were then compared to those derived from the 3D image. The results from both methods were found to be in good agreement (Figure 7).
Acknowledgements
3E’s work on automatic fault detection and diagnosis, including the validation results presented in this article, has received funding from the imec.icon research project ANALYST PV.
Author
Julien Deckx is Product Manager for Digital Solutions at 3E. His main focus is on advanced solar analytics and on asset flexibility optimisation.
References
[1] IRENA (2021), Renewable Power Generation Costs in 2020, International Renewable Energy Agency, Abu Dhabi.
[2] Photovoltaic system performance – Part 3: Energy evaluation method. IEC TS 61724-3:2016. International Electrical Commission, Geneva, Switzerland.


