All insights in this article are taken from PV Tech Research’s new PV InverterTech Bankability Ratings report.
The PV inverter market has witnessed remarkable growth in recent years, driven by the increasing adoption of renewable energy technologies. However, there has been a noticeable shift in focus towards the production and utilisation of large-scale inverters, reflecting evolving market dynamics. While the residential inverter segment experienced years of exponential growth, it is now entering a phase of normalisation. This slowdown is attributed to factors such as high interest rates, policy changes and excess inventory, which have collectively dampened installation rates and growth prospects. On the other hand, the utility-scale inverter segment is expected to undergo several fluctuations before reaching maturity, necessitating careful evaluation of suppliers and a thorough assessment of supply chain risks.
Try Premium for just $1
- Full premium access for the first month at only $1
- Converts to an annual rate after 30 days unless cancelled
- Cancel anytime during the trial period
Premium Benefits
- Expert industry analysis and interviews
- Digital access to PV Tech Power journal
- Exclusive event discounts
Or get the full Premium subscription right away
Or continue reading this article for free
The future of the PV inverter market faces uncertainty due to new policies targeting Chinese manufacturers, who dominate global production. These regulations could impact supply chains and pricing structures, potentially leading to a market downturn. Reduced production capabilities, increased costs and changes in demand will require stakeholders to closely monitor developments and prepare for a fluctuating market.
Our team at PV Tech Research has developed a new quarterly report dedicated to analysing the leading PV inverter manufacturers in the sector. This report leverages a unique methodology for assessing the risk profile of inverter manufacturers to provide comprehensive insights into the financial and manufacturing metrics of key players in the utility-scale inverter market.
The PV InverterTech Bankability Ratings report: evaluating global manufacturers, market dynamics and risk mitigation strategies
The PV InverterTech Bankability Ratings report provides a detailed analysis of over 20 inverter manufacturers, including entities owned by Chinese, European and US companies. Notably, leading manufacturers such as Sungrow and Huawei have achieved top-tier triple-A ratings due to their dominant market share. However, with cybersecurity issues and policy changes affecting inverter shipments, it is prudent to explore alternative suppliers and diversify procurement strategies.
The report also discusses how Chinese manufacturers are expanding globally by establishing production facilities outside China to access international markets. This trend is influenced by recent policy changes, such as the European Union’s Economic Security Doctrine, which flags solar inverters as a high-risk dependency and encourages sourcing from trusted suppliers within the EU and allied nations. Meanwhile, US lawmakers are proposing strict restrictions on Chinese-made inverters due to national security concerns, prompting manufacturers to diversify their supply chains and invest more in non-Chinese production facilities.
Manufacturing
There are five companies with top A-ratings in the bankability pyramid, all of which are Chinese-owned. This ranking focuses on manufacturing and shipment capacities alongside financial health, not market share.
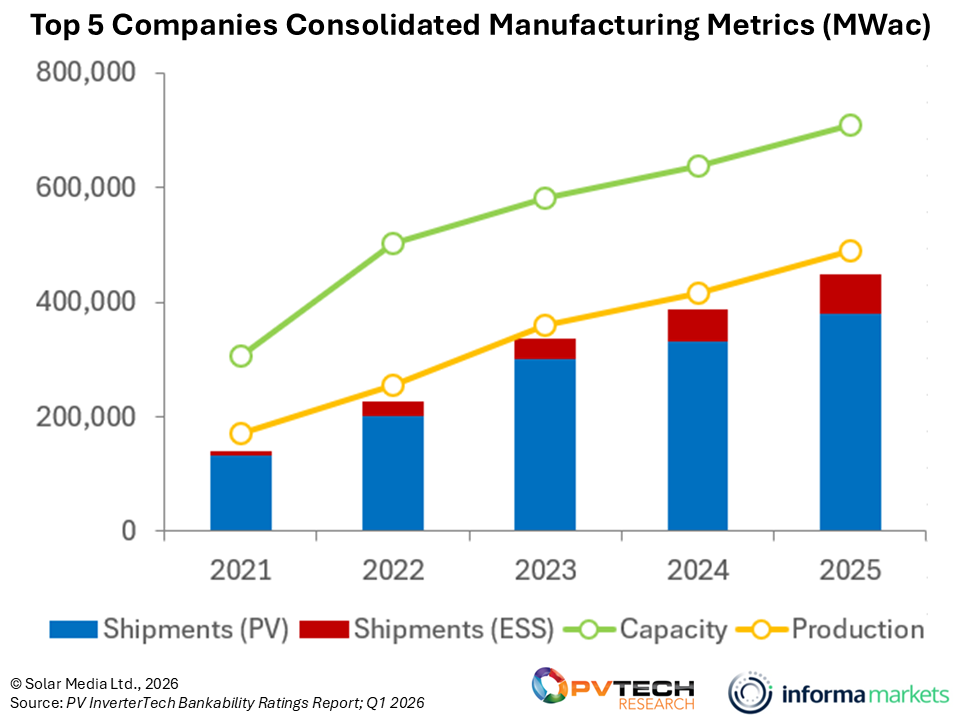
Figure 1 displays key metrics for these companies, including total manufacturing capacity and inverter shipments. Their average utilisation rates have remained around 70% in recent years, allowing for effective capacity boosts without impacting production.
With the growth of the energy storage market, shipments of energy storage inverters have increased to about 15% of total shipments from these top five companies. For non-Chinese companies, this percentage is slightly higher, at around 20%. This trend reflects the expansion of inverter manufacturers into the battery energy storage market at a crucial time.
Over 40% of the top five companies’ shipments go to China, nearly 20% to Europe and about 6% to the US. The low US share is due to Huawei’s blacklisting, which restricts its inverters. In contrast, the top five non-Chinese companies send over 50% of shipments to Europe and the US, with increasing exports to India.
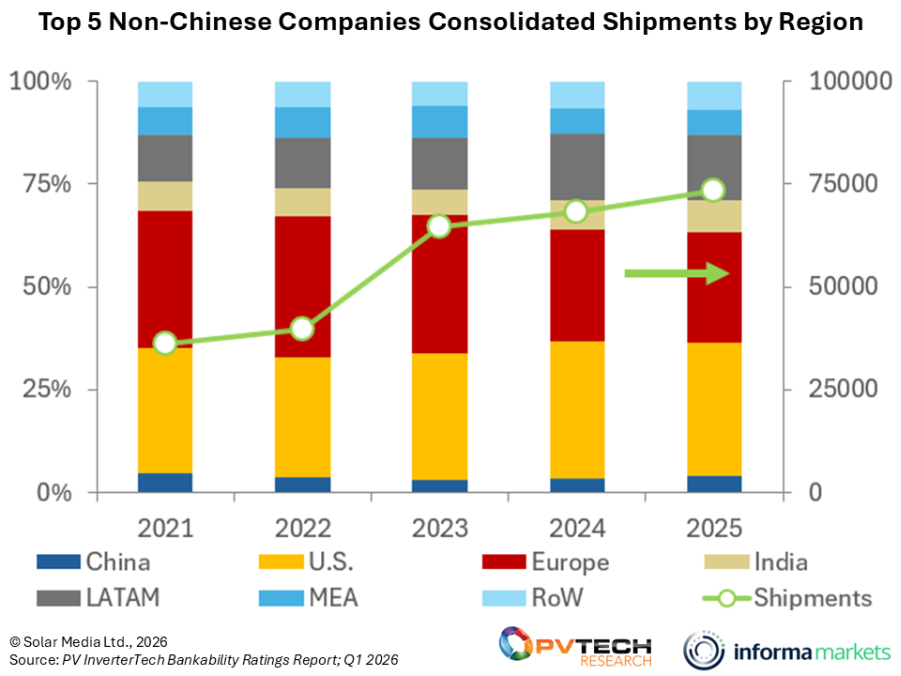
As shown in Figure 2, shipments surged in 2023 for the top five non-Chinese companies. However, there was a slowdown in 2024, primarily due to continued high inventory levels in distribution channels, particularly in Germany and the Netherlands. This situation contributed to a smaller share of shipments to Europe during these years.
The slowdown can also be attributed to the competitiveness of large Chinese companies, which benefit from massive manufacturing capacities. For example, SMA Solar, one of the top five non-Chinese companies, has experienced year-on-year shipment declines since 2023, mainly due to weak demand for its residential and C&I inverters. However, a notable increase in sales of SMA Solar’s large-scale inverters, particularly in the third quarter of 2025, has helped mitigate this decline. The company has recently scaled up its inverter manufacturing capacity, and if it effectively maintains high utilisation rates, SMA Solar has a chance to re-enter the competitive landscape and challenge these large entities.
Financial
The financial outlook for companies in the PV inverter industry is quite strong, driven by rapid market expansion. The year 2025 has been particularly favourable for many of the leading companies that manufacture utility-scale inverters, with financial performance improving for nearly all of those included in the report.
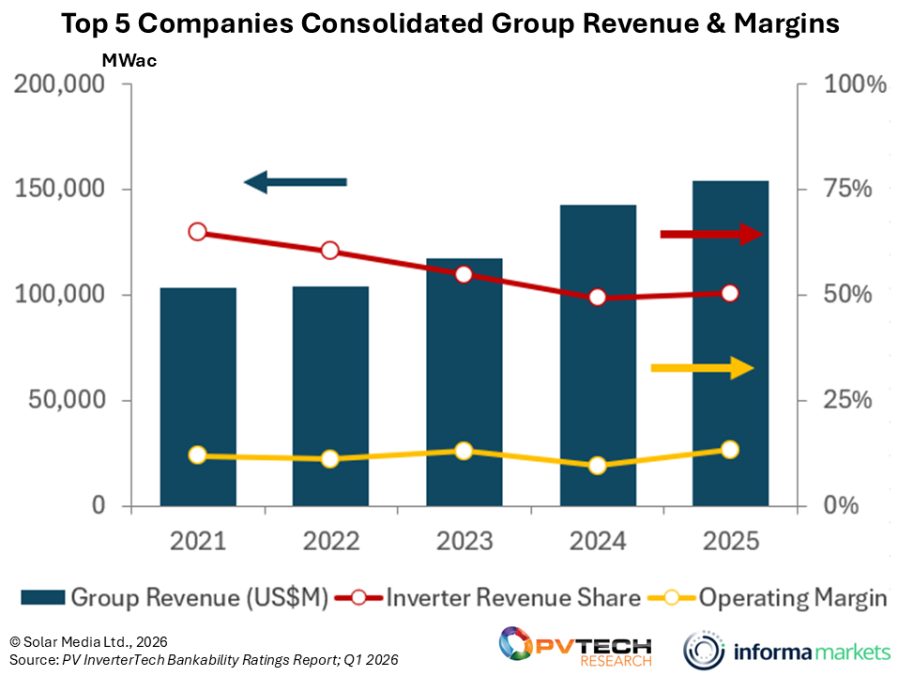
Figure 3 illustrates the performance of the top five Chinese companies in the PV inverter market, showing an overall increase in revenues. Despite total revenue from inverter sales rising, the share of revenue attributed to these sales has decreased to around 50%. This trend is likely due to these companies expanding into the battery energy storage market, which has contributed to a growth in total annual revenues.
Operating margins have remained steady between 10% and 15%, though there was a slight dip in 2024 as most companies invested heavily in R&D, as well as expanding their manufacturing capacities.
Comparing the financials of Chinese and non-Chinese companies in the PV inverter market is challenging, as most non-Chinese firms are privately held. However, shipment figures can provide insight into company performance. Given the slow growth observed over the past two years, we can anticipate a decline in profitability.
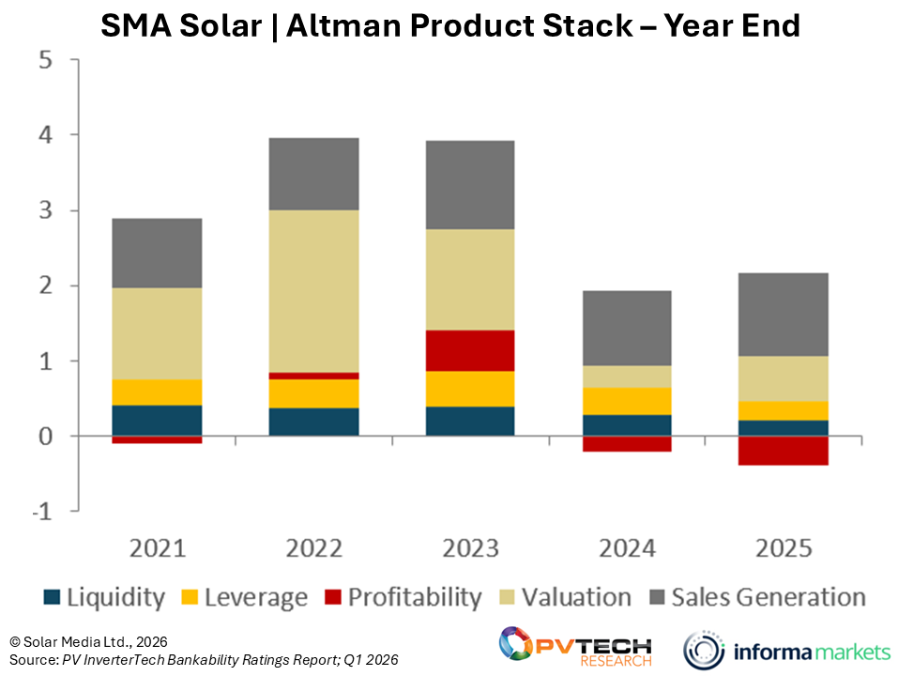
SMA Solar is facing declining profitability due to reduced sales, resulting in negative operating margins for 2024 and 2025. To combat this, the company is investing in expanded production and restructuring to cut costs and improve efficiency, though these efforts entail immediate costs that hurt current earnings. With an Altman-Z score below 1.8, SMA Solar is in the distress zone, indicating potential bankruptcy risk in the next two years. However, the company expects to return to positive EBIT by 2026, suggesting that the low score may be temporary.
European manufacturers, including SMA Solar and Fronius, face significant competition from Chinese firms, leading to financial difficulties and job losses. EU nations such as the Czech Republic and Lithuania are implementing restrictions on Chinese products to enhance energy security.
The planned phase-out of tax credits under the Inflation Reduction Act (IRA) poses a threat to the US inverter market by increasing costs and uncertainty for solar developers. Starting in 2026, solar projects must source no more than 60% of equipment costs from Chinese-owned companies, with further reductions in the following years. Additionally, at least 50% of module materials must come from non-FEOC countries by 2026, rising to 85% by 2029. Companies such as GE Vernova are well-positioned due to their focus on large-scale inverter manufacturing in the US and India.
Methodology: balancing financial health and manufacturing metrics for fair benchmarking
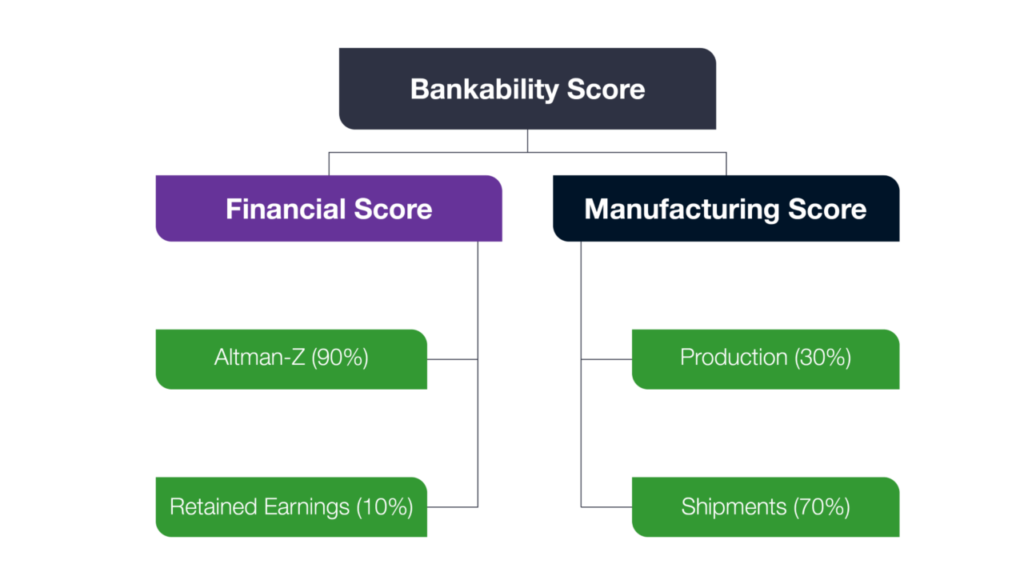
The final bankability score for each company is determined by combining financial and manufacturing scores, calculated through a quarterly benchmarking process.
The manufacturing score is based on production and shipment metrics, adjusted to incorporate a lower cap that prevents skewing results, especially for companies like Huawei and Sungrow, which dominate the global inverter market. Inverters produced and shipped in China are also reduced by 20% to better assess non-Chinese companies and mitigate risks from policy changes affecting Chinese-made inverters.
The financial score uses a modified Altman-Z analysis tailored to the PV inverter industry, incorporating weightings based on retained earnings to mitigate risks for larger companies.
The final bankability score combines the financial and manufacturing scores, categorising companies into different rating bands. An AAA rating represents the highest-performing companies, which usually have strong production and shipment metrics, along with stable or superior financial health. Conversely, a C rating indicates the lowest-performing companies, often characterised by minimal market share and weaker financials.
The PV Inverter Market Pyramid
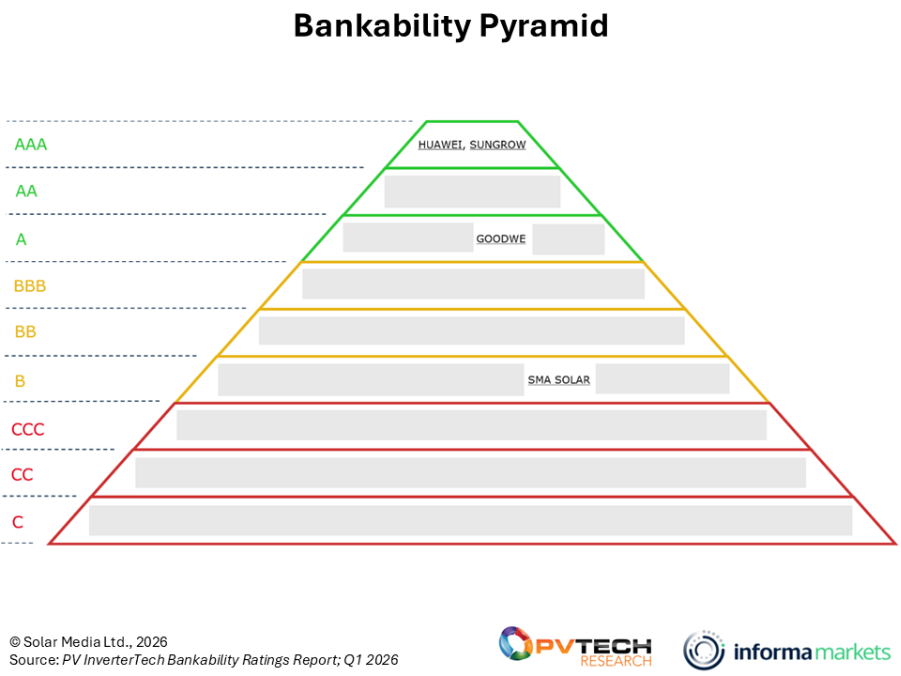
Huawei and Sungrow lead the inverter market, jointly holding over 50% of global market share and maintaining top AAA-Ratings. Both companies boast strong financials and are rated at the top of the pyramid with AAA-Ratings. However, this dominance is unsurprising given their scale and market presence.
Recent policy changes in the EU and US targeting Chinese-made inverters may create opportunities for other companies. For instance, SMA Solar, currently rated B, has potential to recover its previous AAA-Rating from 2021–2023, thanks to strong shipments in key markets. However, increased competition from Chinese manufacturers with massive production and shipment figures has hindered SMA Solar’s ability to expand its market share.
When selecting inverter manufacturers, it’s important to assess their performance across various factors. The PV InverterTech Bankability Report aids in this evaluation for informed decision-making.
Over the next 12 months, significant changes are expected within the Bankability Pyramid due to evolving policies and market dynamics. While the exact outcomes remain uncertain, the heavy reliance of many companies on China-based manufacturing underscores the importance of strategic procurement decisions. As policy changes continue to reshape the landscape, careful evaluation of manufacturers will be critical to navigating this transitional period effectively.
Eventually, the sector may become segmented by geographic supply coverage, influenced by global trade policies or the realignment of residential and C&I versus utility-scale manufacturing to meet the geographic manufacturing demands from the PV inverter industry worldwide.
All data and analysis shown in this article come from our in-house market research team at PV Tech Research. Full details on how to subscribe to our PV InverterTech Bankability Ratings report can be found here. This article has been amended from its original to correct an error on Figure 5.


