Last year analysis by renewables performance aggregator and insurance provider kWh Analytics highlighted the extent of solar asset underperformance against P50 estimates in the US. Here, the company’s Sarath Srinivasan details some of the reasons behind that underperformance.
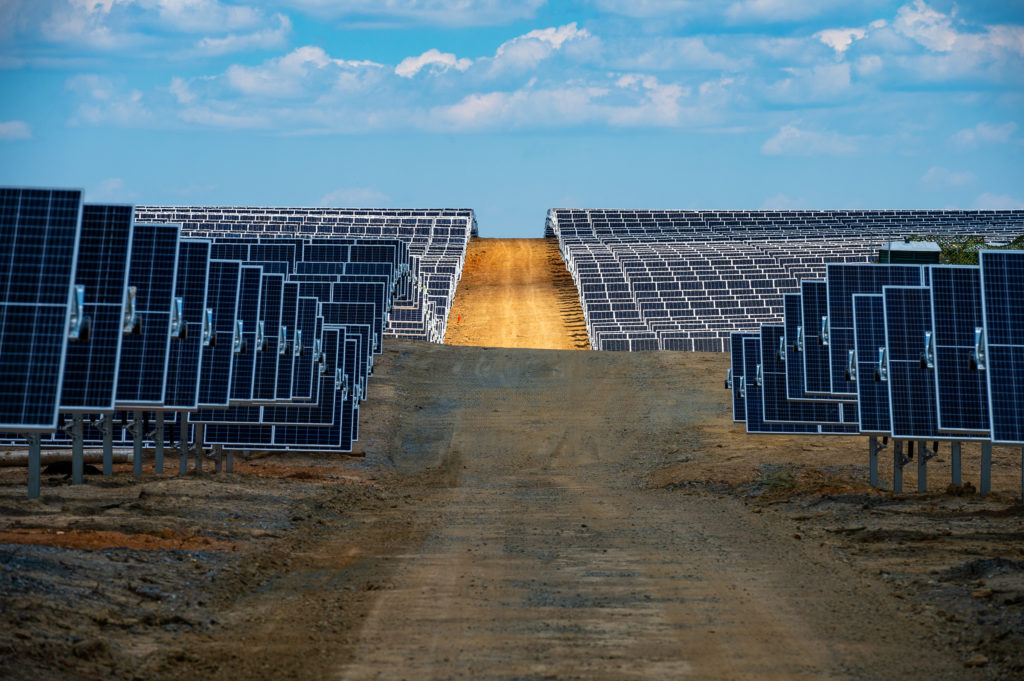
The solar industry has seen tremendous growth in the last decade. From an installed fleet of only 7GW in 2012, today the total amount of solar generation installed in the US has grown to over 114GW. The industry is expected to continue growing at an accelerated pace over the next decade with the installed base of solar expected to quadruple to approximately 400GW.
Try Premium for just $1
- Full premium access for the first month at only $1
- Converts to an annual rate after 30 days unless cancelled
- Cancel anytime during the trial period
Premium Benefits
- Expert industry analysis and interviews
- Digital access to PV Tech Power journal
- Exclusive event discounts
Or get the full Premium subscription right away
Or continue reading this article for free
This growth is supported by a large pool of capital that is being redeployed from traditional energy and infrastructure investments into the energy transition, including solar projects. Most of the capital flowing into renewables comes from the infrastructure investment vehicles mandated to invest in de-risked, stable projects with predictable long-term cash flows. For the industry to mature and deliver on these expectations from investors, it is important to use data to both ensure that the return expectations are appropriate and aligned with observations from the data and also to identify opportunities for improvement where clear gaps emerge.
kWh Analytics, an independent aggregator of renewable energy performance data and the leading provider of Insurance for our climate, collaborated with 15 of the 20 largest US asset owners to publish the Solar Generation Index report in 2021. The report is the industry’s most comprehensive solar energy validation study; it compares estimated average production, or P50s, against actual production with the goal of understanding project performance.
In the 2021 report, kWh Analytics found that solar PV projects chronically underperformed their average (P50) production estimates by 5 – 13% from 2011 – 2020, with the performance worsening over time, particularly in the last five years. Between 2011-2015 some regions were still performing in line with their P50 estimates, but in recent years the performance has been uniformly poor across all regions. The underperformance across different geographic regions and throughout the industry indicates a clear gap between long-term investor expectations and actual performance.
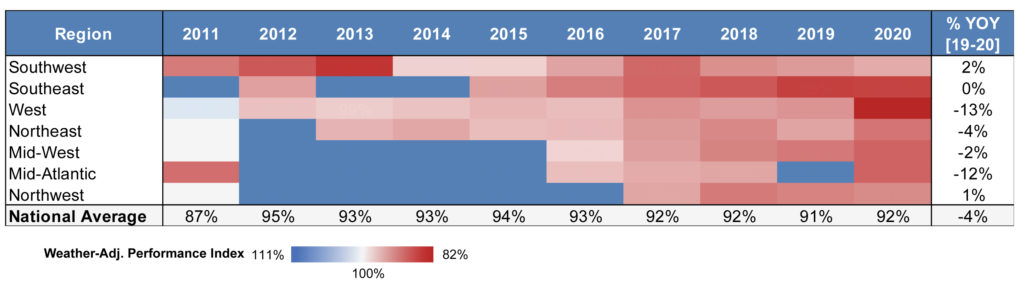
When an equity investment in a solar project is underwritten, the baseline investor return expectation (approximately 7-8% levered return) is that a project will produce at 100% of the P50 level on average over the life of the asset. But over the last five years, the national average has been stable at around 92% and is expected to continue, barring significant additional investments in the assets to rectify the situation. With the typical financing structure of a solar project, the implications of a long-term trend of solar assets in the US performing at a 92% average is likely to have a devastating impact on equity returns.
For example, kWh Analytics looked at a hypothetical 100MW solar project in California with a US$35/MWh PPA. When a solar project performs at 92% of P50 on average over a 10-year period, this results in 8% lower revenue for the project compared to initial estimates. Given the equity investors’ position in the capital structure, the cash flow to equity will be 60% lower in this example, significantly impairing the equity value of these investments. These lower realised cash yields relative to expected cash yields based on aggressive P50 estimates eventually causes investors to recalibrate their expectations, generating uncertainty and volatility in the investment cycle.
“These lower realised cash yields relative to expected cash yields based on aggressive P50 estimates eventually causes investors to recalibrate their expectations, generating uncertainty and volatility in the investment cycle”
This paper examines the underlying causes for the underperformance and looks at a few examples of practical data-driven approaches to risk management for improving solar asset performance. Using data-driven insurance products like the Solar Revenue Put, which now protects over US$3 billion in solar assets, enables investors to benefit from the positive feedback loop of using data driven risk management.
Causes of solar asset underperformance
Every year, kWh Analytics works with leading industry contributors to publish the Solar Risk Assessment. In 2021, contributing firms included independent engineer DNV, renewable asset manager Radian Generation, global renewable operations and maintenance provider Novasource, irradiance forecaster Clean Power Research and tracker manufacturer Nextracker. The report identified several factors contributing to solar asset underperformance including overly optimistic irradiance assumptions, higher-than-expected degradation, terrain and soiling mis-modeling, poor modeling of sub-hourly inverter clipping, higher-than expected equipment downtime and bankrupt manufacturers.
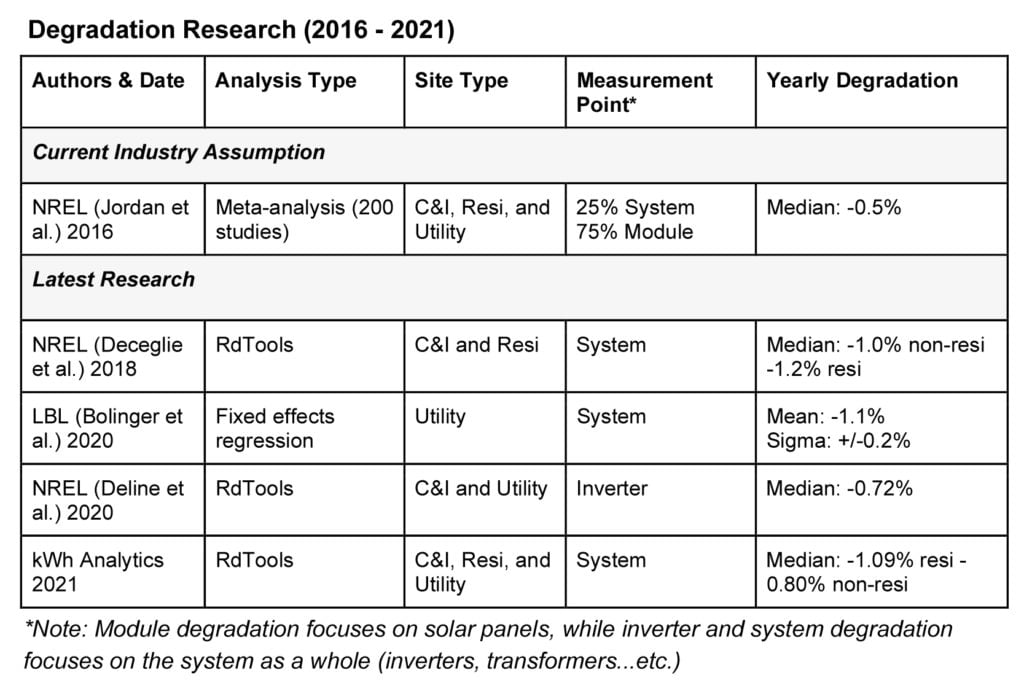
One of the key inputs to estimating a project’s performance over its lifetime is the annual degradation. The industry today uses a 0.5% degradation assumption based on a 2016 study. However, recent research from the National Renewable Energy Laboratory (NREL), Lawrence Berkeley National Laboratory (LBNL) and kWh Analytics shows that the 2016 assumption is outdated and actually underestimates degradation by up to 0.5% annually in some cases.
According to DNV, “Uneven terrain often causes losses for north-south aligned single-axis trackers on east-west slopes and/or rolling terrain due to uneven row-to-row shading and electrical mismatch. Even the most sophisticated slope-aware backtracking cannot recover all of these losses. Furthermore, trackers installed on south- or north-facing slopes may see small gains or losses, respectively.” DNV estimated terrain losses of over 6% in locations with increasing sloped land with the median loss being 2.1%.
In the 2020 Solar Risk Assessment, NextEra Analytics examined energy estimate errors resulting from the outdated method of using hourly temporal resolution for solar energy production modeling despite the known variation of the solar resource at intra-hour time scales due to intermittent cloud cover. NextEra Analytics concluded that: “Results showed that hourly-resolution energy predictions were biased high compared to minute-resolution runs on the order of approximately 1-4%. In addition to location, site configuration (e.g., DC:AC ratio, AC size) also significantly influenced the hourly bias.”
“Even the most sophisticated slope-aware backtracking cannot recover all of these [terrain] losses”
In a paper titled “PV Fleet Performance Data Initiative: Performance Index–Based Analysis”, the National Renewable Energy Laboratory identified inverter downtime as one of the factors contributing to solar asset underperformance. The report noted that “The overall availability in this data set is 97.7%, excluding the first year”, referring specifically to inverter availability. According to Novasource, a key contributor to this trend is the use of equipment from discontinued manufacturers. In the 2021 Solar Risk Assessment, Novasource concluded, “The inverters from a discontinued manufacturer generated a Technical / Gross availability of approximately 85%, meaning that on average the devices were unable to produce power for 15% of the year.
When comparing that to the Technical Availability of the active manufacturers – 92% for Manufacturer 1 and 95% for Manufacturer 2 – it’s clear that the portion of the fleet comprised of the defunct manufacturer’s equipment significantly underperformed that of the fleet with OEM support. What accounted for the additional downtime for the unsupported inverters? The disparity is almost entirely due to two factors: 1) the inability to get effective technical support and 2) the delay in locating and procuring replacement parts. The average interruption was seven days for Manufacturer 2, 20 days for Manufacturer 1, and over 60 days for the discontinued inverter manufacturer.” Meanwhile Radian Generation concluded that “An analysis of nearly 2GW of utility and commercial solar plants in 2020 shows that 80% of performance-related plant tickets are caused by inverter outages,” indicating that inverters continue to remain the main source of availability losses in solar projects.
Leveraging data to deliver superior risk-adjusted returns to solar asset investors
The insurance markets have led the way in enabling innovation through the use of data in every major asset class – except solar, up until now. The path to maturation of the solar investment asset class and continued access to a lower cost of capital, lies in leveraging data-driven insurance solutions to improve the risk profile. This strategy enables investors to rely on data to generate superior risk-adjusted returns by placing an effective floor on equity cash flows and reducing the volatility and tail risk of solar asset returns. By using data across the lifecycle of a project, investors can develop more certainty in their production forecasts, and better manage operations and maintenance.
Production insurance
Data and data-driven insurance products can, over time, help bridge the gap between actual and expected solar asset performance. In project finance, whenever a counterparty that’s best positioned to take on a risk is able to do so, the project returns improve for all counterparties on a risk-adjusted basis. A specific counterparty might be best positioned to take on a risk either due to the ability to directly mitigate the impact of the risk factor or due to having superior data to enable better pricing of the risk.
When investors rely on historical data and use insurable production estimates in calculating their return expectations, the quality of investment decisions improves, resulting in improved risk adjusted returns. For example, if an investor tries to insure a project with aggressive P50 estimates, the high price of the insurance creates a feedback mechanism for the market that allows investors to adjust their views. Alternatively, the presence or absence of production insurance could be used by investors to discern the risk inherent in accepting the P50 estimates of the project.
Currently, equity investors are exposed to the risk of aggressive P50s on most solar projects, but they are not always best positioned to take on the risk. When it comes to solar asset performance, insurance products like kWh Analytics’ Solar Revenue Put are best positioned to take on the tail risk of chronic asset underperformance. This is driven by insurers’ ability to take on weather risk, aggregate the performance risk across a large volume of insured projects and access to high quality data. For a single asset, underperformance could lead to catastrophic impairment of equity value. However, when aggregated across the solar fleet, the cost of insuring against this risk becomes manageable and creates the ability to improve risk-adjusted returns.
Using data to improve operations and maintenance
Wood Mackenzie, an energy research and consultancy firm, noted in the Solar Risk Assessment: 2021 that, “Digital technology has become an established tool of plant asset management for renewables operations, however solar lags behind wind in fully deploying these tools.”
In addition, Fracsun also noted in the report that onsite measurements of soiling compared to original IE estimates of soiling have a mean relative error of 99.5%. Using onsite soiling data and documenting the trends over time would help asset managers mitigate soiling losses by optimizing how and when to clean the plant. Similarly, tracking vegetation conditions and growth accurately over time will help improve decision making on vegetation management scheduling, which can be based on local growth cycles as opposed to one-size-fits-all bi-annual or quarterly mowing. Proactive soiling management strategies triggered by monitoring data trends associated with local irregular events such as winds and regional wildfires could also help alleviate abnormal soiling losses.
Turning a blind eye to chronic solar asset underperformance damages the industry’s credibility with investors. This weakens the very foundations of the industry and threatens continued access to an ever-decreasing cost of capital that has been crucial for the growth of the industry. To start the next chapter of growth on a firmer footing, the solar industry must adopt data-driven risk management approaches to enable the delivery of stable long-term returns to investors and financing counterparties.
Author
Sarath Srinivasan
Sarath Srinivasan is the head of risk transfer products at kWh Analytics, a leader in climate insurance that’s insured over US$3 billion of solar assets to date. With over a decade of experience in renewable energy project finance closing over US$5 billion in transactions. Previously, Sarath managed the solar business unit at Gardner Capital, helping acquire, develop and finance over 120MW of solar projects in the southeast and midwest, was instrumental in financing over a 100MW of C&I solar projects at SunEdison and was also a part of the Power and Utilities investment banking team at Barclays.


