US utility-scale solar additions grew by 56% in 2024, reaching 30GW from 2023’s 19GW and representing over 54% of all new electricity generation capacity added in the country last year.
The new utility-scale solar 2025 data update from the Lawrence Berkeley National Laboratory records annual data on the US utility-scale solar sector.
Try Premium for just $1
- Full premium access for the first month at only $1
- Converts to an annual rate after 30 days unless cancelled
- Cancel anytime during the trial period
Premium Benefits
- Expert industry analysis and interviews
- Digital access to PV Tech Power journal
- Exclusive event discounts
Or get the full Premium subscription right away
Or continue reading this article for free
The data shows that utility-scale PV deployments were not uniformly spread across the US in 2024, with growth concentrated in Texas, the Midwest and the non-independent system operator (ISO) West and Southeast regions.
The Electric Reliability Council of Texas (ERCOT) grid saw 7.6GW of new utility-scale PV capacity in 2024, followed by the Midcontinent Independent System Operator (MISO) grid (6GW) and the non-ISO grids in the West and Southeast (largely Florida), both with 4.7GW of new utility-scale solar capacity.
The report provides a range of granular data on utility-scale PV deployments and the market at large.
Utility-scale solar costs
Berkeley Lab’s report showed that the average capacity-weighted cost of installed utility-scale solar rose fractionally from 2023 to 2024; from US$1.59/Wac to US$1.61/Wac. The “robust” 2024 data is based on records from 425 projects, which Berkeley said was 92% of new projects.
However, the cost of utility-scale PV varied significantly by region and grid. ERCOT saw the lowest prices, under US$1.5/Wac, while most other ISOs saw prices around the US$1.5/Wac mark. The outlier was the New York Independent System Operator (NYISO), which saw prices over US$2/Wac.
Berkeley Lab said this variation was due to land availability, prevailing labour rates and transmission network upgrade costs
The national average levelised cost of energy (LCOE) for utility-scale PV rose by 13% last year, from US$53/MWh to US$60/MWh without tax credits, and from US$36/MWh to US$41/MWh with Investment or Production tax credits. Higher financing costs, increasing capex and slightly lower estimated performance pushed the national average LCOE up, the report said.
Single-axis trackers dominate, c-Si grows
Almost all (99%) new utility-scale solar projects deployed single-axis trackers instead of fixed-tilt mounts last year. Just 12 projects deployed fixed-tilt racking in 2024, compared with 236 tracker-mounted installations.
The cost of tracker systems fell in 2024, which, combined with the tracker projects’ higher energy yield per installed capacity, made tracker systems far more attractive to project owners. Fixed-tilt systems are only now found in “challenging” environments, such as areas with extreme terrain or high risk of adverse weather.
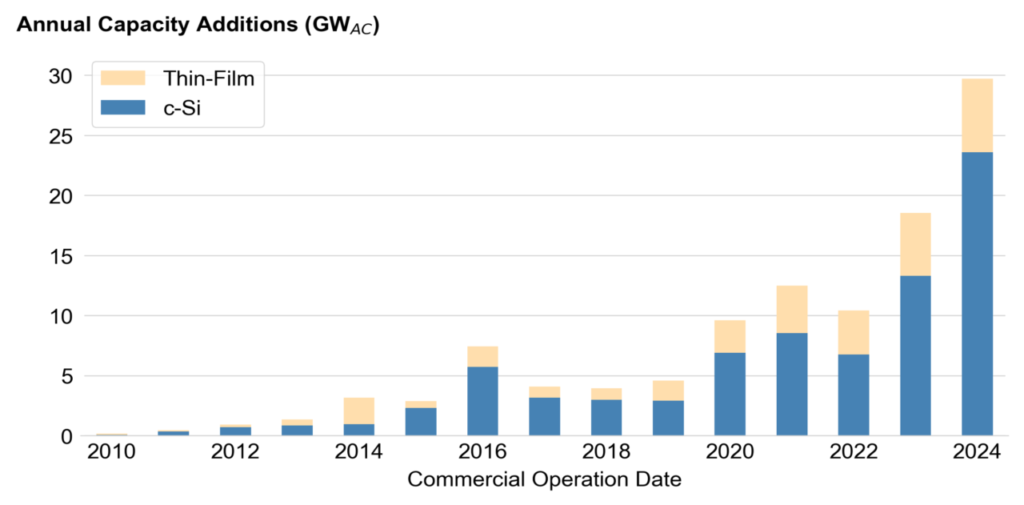
Last year also saw a significant expansion in the deployment of c-Si solar technology at utility-scale. Annual c-Si solar capacity almost doubled in 2024, reaching 23.4GW compared with around 13.3GW in 2023.
By contrast, thin-film deployments remained fairly constant, rising by under 1GW from 5.24GW in 2023 to 6.13GW in 2024. This is likely because the US only has one major thin-film module producer, First Solar.
The US had 79.19GW of utility-scale c-Si solar capacity and 30.74GW of utility-scale thin-film capacity as of the end of 2024.
Corporate offtakers surge
Corporations were the biggest buyers of utility-scale solar power in the US last year, a first for the industry.
Corporate offtakers signed power purchase agreements (PPA) for 9.8GW of utility-scale solar power in 2024, representing 33% of all deals signed. Investor-owned utilities signed PPAs for 5.4GW, monopoly investor-owned utilities 5.2GW and public utilities 4.6GW.
This marks the first time that corporations have led the offtake figures, according to Berkeley Lab’s publicly available data, and 2024 also saw corporate PPA capacities more than double. Last year, corporate PPAs amounted to 4.7GW, trailing the 6GW agreed by investor-owned utilities.
The corporate solar PPA sector really kicked off in 2020, when annual deals rose from 684MW to over 2.2GW. Barring a slump in 2022 it rose gradually, by around 1GW a year, before jumping substantially in 2024.
US big tech companies have led corporate solar power deals in recent times. Giants like Amazon, Google and Meta have all inked multiple GWs of deals for utility-scale solar, largely to support the operation of data centres.
Lawrence Berkeley National Laboratory’s data report can be found here.


