Yesterday on PV-Tech, we explained what to expect from p-type multi c-Si modules during 2017 and 2018, across various p-multi cell configurations. Today, we show a similar analysis, but for p-type mono.
With market-share gains expected in the next 2-3 years from p-type mono, knowing what can be expected from 60-cell and 72-cell designs is perhaps more appropriate in terms of benchmarking undertaken by n-type and thin-film competitors.
Try Premium for just $1
- Full premium access for the first month at only $1
- Converts to an annual rate after 30 days unless cancelled
- Cancel anytime during the trial period
Premium Benefits
- Expert industry analysis and interviews
- Digital access to PV Tech Power journal
- Exclusive event discounts
Or get the full Premium subscription right away
Or continue reading this article for free
The methodology used to generate the graphics was explained in the blog yesterday. The full analysis is adapted from the January 2017 release of our PV Manufacturing & Technology Quarterly report. The themes are set to be discussed at the forthcoming PV CellTech 2017 event in Penang, Malaysia, 14-15 March 2017.
Greater variation in p-mono module power ratings
Compared to yesterday’s analysis and discussion on p-type multi c-Si efficiencies and power ratings, there is a greater delta between the lowest powers today (3BB and 4BB standard p-type mono cells using M0 size wafers) and the highest powers (4BB and 5BB PERC on M2 size wafers).
The following three graphics compare these two groupings for p-type mono modules, noting that there are other p-type options occupying the middle-ground.
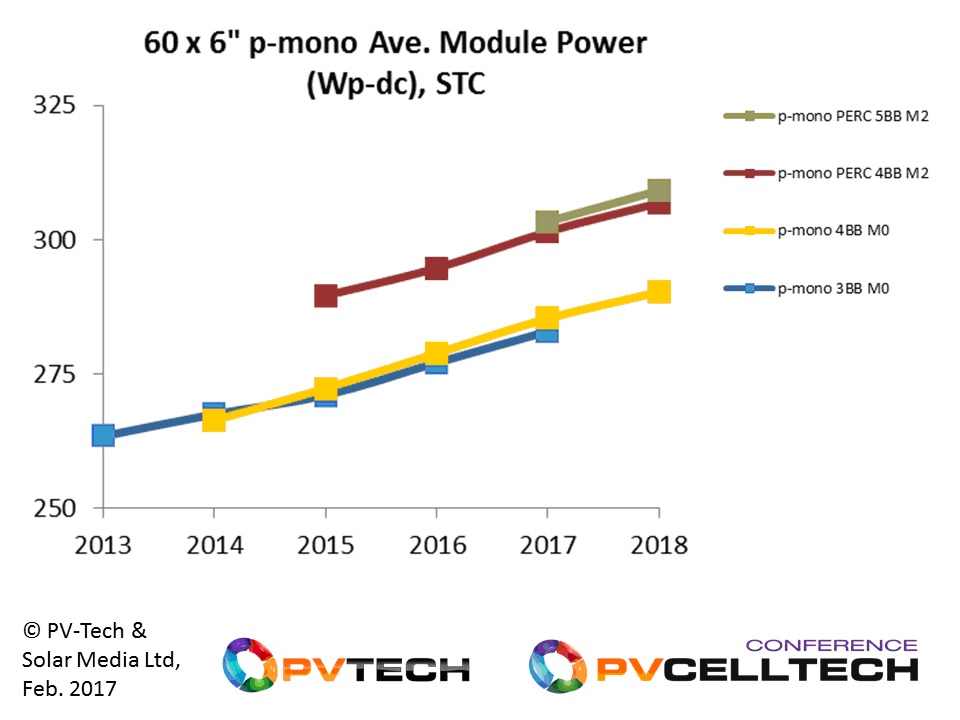
The first graphic shows 60-cell average panel powers by year, with the average ratings from the lead variant (5MM PERC on M2) close to 310W (Wp-dc, STC) next year.
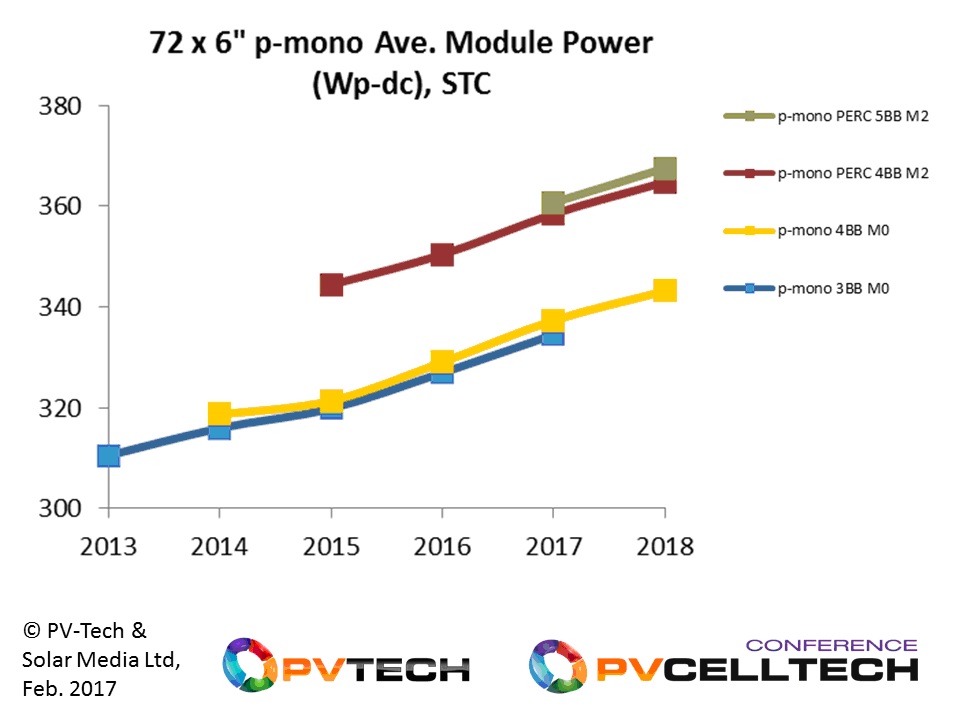
The next graphic shows 72-cell power ratings, where the 5BB PERC on M2 wafer version is forecast to be supplied with average powers approaching 370W (Wp-dc, STC) next year.
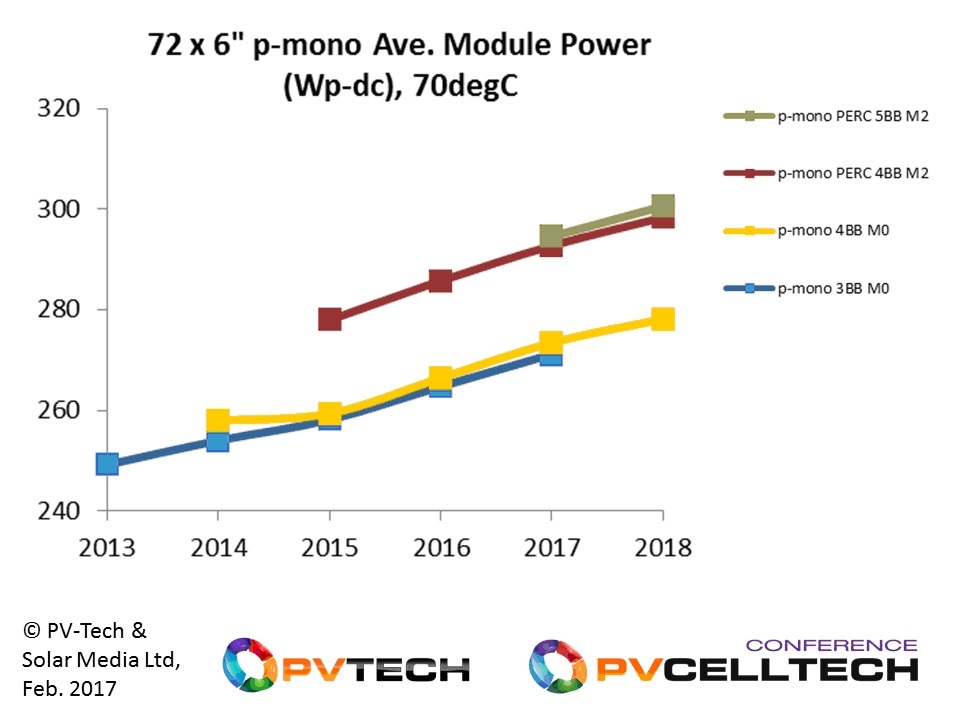
The final graphic shows the above 72-cell variants, but at the elevated temperature of 70 degrees. Here the highest performing panels are operating with average levels close to 300W (Wp-dc).
In addition to the higher power levels coming from M2 wafers, and the increasing combination of 4-5BB design using the supply of this larger wafer size, efficiency gains for PERC on mono are more incremental when compared to p-multi module equivalents. This is not uncommon for advanced cell design on mono, compared to multi.
The scope for 72-cell p-mono options to push towards 400W (STC) during 2019-2020 is entirely feasible, if attention returns to the front-surface and selective emitter options.
Company-specific module technology and power ratings are included in the PV Manufacturing & Technology Quarterly report. More comparative data (including n-type and thin-film powers) will be presented at the forthcoming PV CellTech 2017 event in Penang, Malaysia, 14-15 March 2017
To view the latest PV CellTech agenda, please follow this link. To register for the event, click here.
We are also doing our latest free webinar series, titled “Solar PV manufacturing and technology trends; impact of global market drivers” on 15 and 16 February 2017; click here to register to attend one of these webinars.


