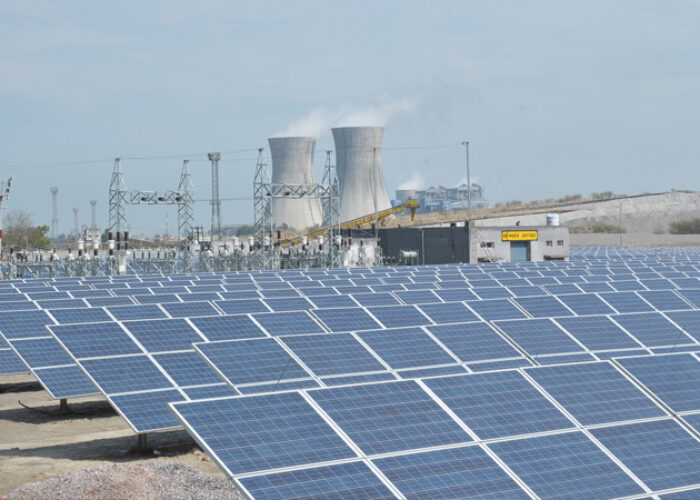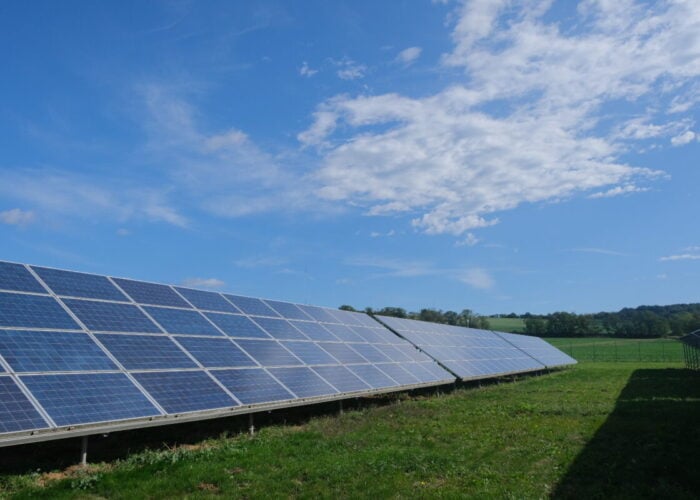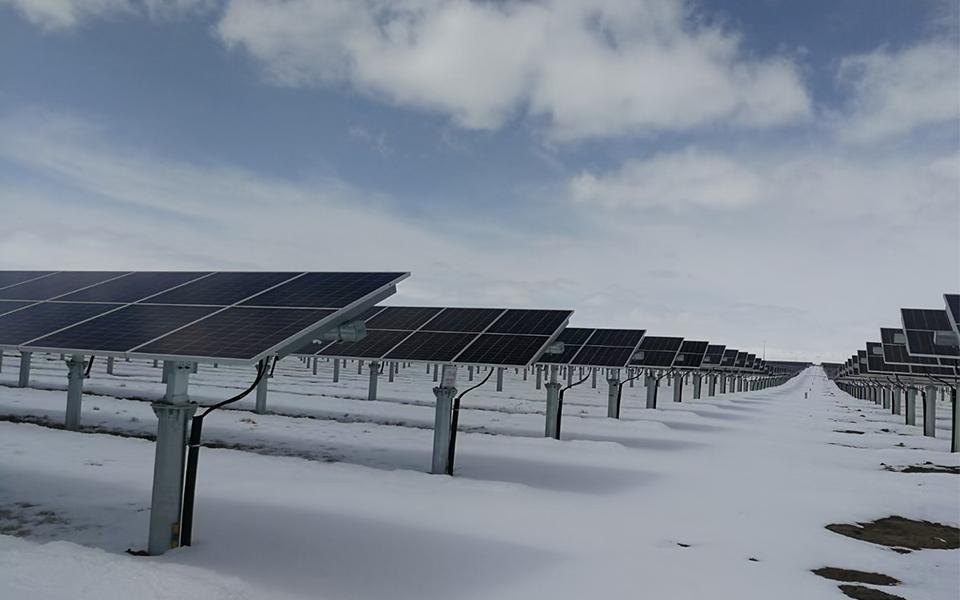
The world has reached “a global irreversible solar tipping point” at which point solar will become the most efficient and cost-effective form of electricity generation over the coming years, a report from the Global Systems Institute at the UK’s University of Exeter in the UK has concluded.
The researchers published the paper, ‘The Momentum of the Solar Energy Transition’, earlier this week, which considers the relative maturity and technological sophistication of a number of forms of power generation, including solar, renewables and fossil fuels, from the present day to 2060.
Unlock unlimited access for 12 whole months of distinctive global analysis
Photovoltaics International is now included.
- Regular insight and analysis of the industry’s biggest developments
- In-depth interviews with the industry’s leading figures
- Unlimited digital access to the PV Tech Power journal catalogue
- Unlimited digital access to the Photovoltaics International journal catalogue
- Access to more than 1,000 technical papers
- Discounts on Solar Media’s portfolio of events, in-person and virtual
As demonstrated in the graph below, the report’s authors expect solar PV to dominate the global energy mix by 2050, and account for more than half of the world’s electricity generation by 2044. This is in stark contrast to the fossil fuels sector, with the contribution of gas and oil to the global energy mix expected to fall from 23.93% to 7.78% for gas, and 2.74% to 2.49% for oil, from 2020-50
The fate of solar is also at odds with other forms of renewable power generation, with onshore wind and hydropower expected to see their relative contributions to the global energy mix fall over this period.
The authors attribute the ongoing expansion of the global solar sector to technological innovations and effective policy, alongside the strong “learning rates” associated with the sector, which have helped create an industry that exists in a constant state of self-appraisal and growth
“There are many reasons why solar has experienced such high learning rates,” write the report’s authors. “Its simplicity, modularity and mass-scale replicability allow for significant learning opportunities, related to those seen across the electronics industry.
“Indeed, numerous spillovers have originated from the computer industry,” continue the authors. “Innovation and improvements to solar PV are ongoing. For instance, the commercialisation of (hybrid) perovskite cells holds promises for higher efficiencies and lower unit prices. Due to decreasing technology risks and financial learning, finance is partly cheaper to procure.
Falling solar costs
Another key reason for this trend has been the consistent decline in the cost of producing electricity from solar sources. The report notes that, from 2010-20, the levelised cost of electricity (LCOE) in the sector fell by 15% each year, and over this period, the world’s installed capacity of solar power increased by 25% each year.
This echoes conclusions drawn by the International Renewable Energy Agency (IRENA), which noted that global solar LCOE fell by 3% between 2021 and 2022, a slower rate of decline, but one that still demonstrates the falling cost of installing new solar capacity, making solar projects more financially attractive to potential investors.
The graph below shows how the fall in solar LCOE compares to that of coal and wind in the US and China, two of the world’s energy superpowers. In both countries, the cost of producing electricity from coal increased from 2020-50, reaching a high of US$117.37/MWh in the US, and perhaps most significantly, the LCOE in the Chinese coal sector increased above that of the LCOE in the US solar sector over this period.
These encouraging figures for the solar sector have underpinned greater growth compared to other renewable sources. The report notes that, compared to the additions made to global solar capacity, onshore wind capacity grew just 12% year-on-year, between 2010-20. The authors conclude, that, should these rates of growth persist, solar and wind will be the world’s dominant energy sectors within two decades, with solar particularly influential.
“In 2020, wind energy has the lowest LCOE in a majority [of] the 70 regions defined in the E3ME-FTT models,” write the report’s authors. “[Where] this is not the case, solar PV, nuclear or coal dominate. By 2030, this has flipped, in favour [of] solar power across most of the world.
“We assume a uniform declining cost per kW of PV panels worldwide, with differing solar irradiation for each region,” continue the authors. “Due to this international spillover effect, most regions of the world are likely going to gain access to low-cost solar energy.”
Challenges remain
The report’s authors, however, noted that the world’s energy grids will need to be expanded and upgraded to meet much of this demand. Earlier this year, both the US and European solar sectors reported concerns regarding the capacity of their respective power grids to integrate a growing portfolio of solar projects, and this is something the Exeter academics are keenly aware of.
“This includes how to deal with the seasonal variation for which batteries are ill-suited,” write the report’s authors. “The cost of managing large amounts of intermittency could offset further cost reductions in solar panels and wind turbines, impeding their rapid diffusion. The unequal availability of finance to support solar and wind investments in various countries may be an issue, too.
“Supply chains may be poorly prepared for such a rapid technological roll out,” conclude the authors. “Finally, political resistance in areas of declining fossil fuel use or trade could curb the willingness of governments to embrace a solar revolution.”
Ultimately, however, there may be requisite willpower around the world to support this transition, through investment and policymaking. The graph below demonstrates that investment in the global solar sector is set to peak in the coming decade, and continued investment around the world will be a prerequisite for the solar sector to meet these challenges.

