The solar industry is set to reach annual demand at the 100GW level much earlier than has been forecast by both third-party observers and the leading component suppliers. During 2018, the solar industry is shaping up to ship more than 100GW of solar modules during the calendar year, while 2017 alone will see the number exceed 90GW comfortably.
But with such a rapid growth in annual module shipments, it begs the obvious question: is quality of modules being compromised in the rush to increase shipment targets while implementing new module concepts often requiring new materials and cell types used?
Unlock unlimited access for 12 whole months of distinctive global analysis
Photovoltaics International is now included.
- Regular insight and analysis of the industry’s biggest developments
- In-depth interviews with the industry’s leading figures
- Unlimited digital access to the PV Tech Power journal catalogue
- Unlimited digital access to the Photovoltaics International journal catalogue
- Access to more than 1,000 technical papers
- Discounts on Solar Media’s portfolio of events, in-person and virtual
Furthermore, with the relentless rush to move blended module production costs (or cost of goods sold) south of 30c/W in 2018, and to adjust to ASPs in the low thirties, is this offering up another potential hazard in terms of module quality and long-term reliability, if the bill-of-materials is focusing quickly on cost reduction as a short-term metric for profitability?
Questions indeed: and ones that ultimately are felt most painfully in contractual discussions between site asset owners and third-party O&Ms when site performance ratios are agreed upon, or in bonus payments based on site over-performance.
This two-part blog series takes a close look at the factors driving 2018 to be a 100GW-solar year, and provides some reasons why market forecasts of the past few years have all been way below actual solar deployment levels.
With the PV ModuleTech 2017 conference less than 3 months away (Kuala Lumpur, 7-8 November 2017), this blog series also explains why this dedicated two-day industry event has the potential to provide some key answers for EPCs, developers and asset owners, in terms of understanding the key metrics that underpin solar modules going forward, ultimately mitigating risks during site design and build-out, while optimizing overall return-on-investment for more than 20 years in the field.
In part 1 of the blog series, we focus on the problems in tracking solar PV market demand and module supply, and present a new methodology that sees the industry shipping more than 90GW in 2017 and over 100GW in 2018. Tomorrow, part 2 of the series will address module quality concerns and what the downstream-active segments of the market need to be aware of today, in order to make informed judgements on module supplier and technologies designed into utility-scale deployment going forward.
Solar module supply: 100GW in 2018?
End-market demand for solar in the past few years has exceeded all of the forecasts that have been set at the start of the year. Indeed, even forecasts during the year have been significantly lower than final numbers reported the following year.
When the stack of demand, and supply, is collated each year, for the prior 12 month period, it becomes clear why the forecasts have been low, and which countries or regions ended up accounting for the upward revisions. But the big question comes back to: why are third-party observers getting the numbers so wrong each year, and why always on the low side?
It would appear that many are still obsessed with spending six months or more during the following year, adding up what happened the year before. While of great value to the historians, this gives no help at all to the here-and-now, and what is going to happen in the next 3-6 months, far less 2-3 years out. Tracking supply and demand in real-time would appear to be something that has yet to be cracked in the solar industry, and I touch below on a few of the factors causing this.
There is still too much dependency waiting for government data to be released, generally months after the event, without any form of independently checking, and always incorrectly phased in terms of supply owing to government statistics having interconnection or accreditation dates as the reference points for capacity additions.
How many times in the past three years have we seen market forecasts given step-wise upward revisions overnight, after China issues its quarterly update on deployed solar in the country?
When looking purely at the supply of modules, the big problem for most market observers remains the very large number of companies active in the market with about 1GW or higher capacity levels, and the scale of operations within China that stays only in that country. If the solar industry had 3-4 module suppliers accounting for >90% of all global shipments, market demand would be best tracked by focusing only on the monthly or quarterly regional shipments from these companies, and this would give the best guide on demand (albeit with a strong supply-driven element).
The methodology we have developed at PV-Tech in the past couple of years is to segment the 50+ leading module suppliers that account for approx. 90% of module shipments (combining in-house produced and third-party outsourced modules), and segment these companies by quarterly and regional shipment allocations. This includes forecasting out 12-18 months. This is then cross-checked with estimated end-market demand, which is a combination of government data and tracked end-market drivers. The result of this provides a more optimistic viewpoint of end-market supply that historically provided by third-party observers, but can be seen to be more closely aligned with the demand data that is provided after the event.
The other reference point relates to key components, and finding a methodology to triangulate module supply with raw materials or components. Unfortunately, doing this with backsheets or inverters or mounting systems, for example, have not been shown to be good approaches in recent years, but polysilicon supply can be used perhaps as the most valuable feed here.
Solar is consuming such as high percentage of polysilicon production now, compared to semiconductor, and the number of polysilicon suppliers is still the least fragmented in terms of competition. However, there is still too much dependency on using historic data released by China for polysilicon imports. Nonetheless, assuming correct g/W metrics are used, and the trends of the leading polysilicon producers can be evaluated with regards to utilization rates and inventory control, then it is probably the best leading indicator of module supply 3-6 months out.
The graphic below shows our current forecast for module supply annually, out to the end of 2018, where historic data back to 2013 is displayed for legacy demand comparisons.
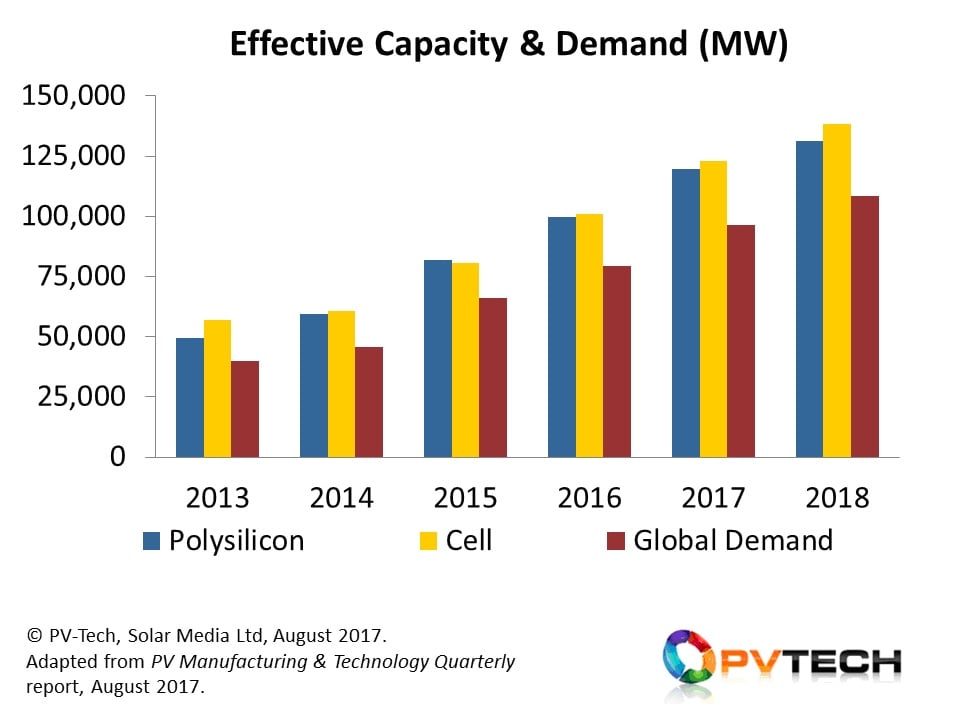
Superimposed on the demand forecast graphic above are two key capacity metrics. This shows bottom-up effective and annualized capacities currently available for polysilicon (for solar) and cell production (including c-Si and mass-produced thin-film). While there are further layers of complexity in segmenting the effective capacity by region, technology, and competitiveness, it nonetheless shows a healthy delta in the supply side in supporting the 100GW in 2018 estimate in end-market demand for now.
China and Non-China: two solar worlds but intricately linked
To say that China is driving the solar industry today is a gross understatement. In fact, if anything, I don’t feel that the sheer scale of this has been fully absorbed, especially outside China and Taiwan.
China dominates polysilicon production, ingot production, wafer production and still cell/module production. And it accounts for almost half of global module supply and deployment today. That’s as close to dominance as you are likely to see.
Upstream, production factors feed into all global manufacturing plans, technology roadmaps and ASP/cost targets, due to the levels of modules that are still exported from China to non-trade-barrier restrictive regions, but also owing to the massive amount of cell/module capacity across countries in Southeast Asia that is available to Chinese-headquartered module suppliers.
One example of this unfolds today in the benchmark being set by Canadian Solar to hit full-module blended global manufacturing costs sub 30c/W existing 2017; a marker announced by the company at the end of last year, and as of last week, apparently well on track to being reached. Another example related to module configurations (60/72 cell) and powers (PERC/non-PERC for example), and how the technology plans of non-Chinese companies are referenced to the leading Chinese module suppliers today.
Downstream is a different proposition altogether. It is still fair to say that the Chinese end-market is for the Chinese manufacturers and EPCs/asset-holders, with heavy state-owned influence permeating the rate of deployment and chosen partners across the value-chains specific to each site. Her, one can say firmly that global module suppliers fall into three categories:
• China-based, supply-dominated by domestic business
• China-based, with global-brand and supply track-record/aspirations
• Non-China based, with a served addressable market that excludes China and a solar industry that looks more like a 50GW than a 100GW end-market
Only the China-based/global-served module suppliers have a served addressable market anywhere close to the total addressable market, and drilling down more into the range of Chinese companies that occupy this sub-set, only a small handful truly have global sales and marketing outlets that appear to the world outside China as non-Chinese and regional-savvy.
Getting the global sales/marketing message right for Chinese companies operating outside China is still a big challenge, and today that list is mainly confined to JinkoSolar, Trina Solar, Canadian Solar and JA Solar. All other Chinese challengers are some way behind, and seek only to mimic the activities of these multi-GW suppliers going forward, and most of these challengers have no manufacturing outside China that allows them to play in the all-important (from a branding perspective) US and European markets.
Within the above list of companies, one has to add Hanwha Q-CELLS, as the only non-Chinese headquartered company (Korean) that, by virtue of its legacy origins as a Chinese cell/module producer (Solarfun), has the ability to serve both China demand (from Chinese operations) and global demand (from China/Malaysia/Korea).
Interestingly, we have just listed 5 of the 7 Silicon Module Super League (SMSL) companies, not a coincidence by any means. The final members of the SMSL are LONGi Solar and GCL (Systems Integration), two companies today putting considerable resource into being the next leading Chinese module suppliers on the global PV stage.
However, the swing factor in play from China in the solar industry is not coming from the mix of module suppliers and the market-share of module supply of the SMSL globally, but what will be deployed in China this year and going forward.
Our forecasts largely ignore government rhetoric on meaningless metrics that exist regarding the country’s constantly-moving 5-year plan for solar deployed: rather, the above global supply forecasts assume that sustaining jobs in China for the solar industry ultimately triumphs over all other considerations and in the short-term, is essentially fuelling a growing end-market supply/demand dynamic that continues to see investment flow into the domestic sector.
What happens 3-5 years out is another question of course, but the first thing is to get a better handle on the rest of 2017 and the 12 months of 2018. In this context, there are too many signs now that 2017 will exceed 90GW and 2018 the 100GW level. And during this time period, the China/non-China issue will be as pertinent as it is today.
Part two of this blog series will continue tomorrow, looking at what this all means for global module supply, module quality, and third-party audits/certification, and what metrics the downstream channels (EPCs, O&Ms, asset-owners) should be looking at when specifying module supply and site performance ratio’s.
All these themes form the basis of PV-Tech’s new event PV ModuleTech 2017, taking place on 7-8 November 2017, and where many of the leading module and materials suppliers will be explaining what is relevant to downstream EPCs and utility asset-holder and investors. Click here to learn more about the agenda and how to get involved.
PV-Tech will be hosting a free webinar on the 30th and 31st August, covering PV Module Supply in 2017: Leading global suppliers, performance benchmarks & maximizing investor returns. Click here to register.

