The Australian Energy Market Operator (AEMO) has found that grid-scale solar PV generation achieved an all-time high in Q1 2025, reaching 2,386MW, a 10% year-on-year (YoY) increase.
According to the organisation’s latest Quarterly Energy Dynamics report released yesterday (7 May), utility-scale solar PV’s strong generation in the quarter helped the renewables make up an average of 43% for the electricity mix in the National Electricity Market (NEM).
Try Premium for just $1
- Full premium access for the first month at only $1
- Converts to an annual rate after 30 days unless cancelled
- Cancel anytime during the trial period
Premium Benefits
- Expert industry analysis and interviews
- Digital access to PV Tech Power journal
- Exclusive event discounts
Or get the full Premium subscription right away
Or continue reading this article for free
The growth in grid-scale solar PV output was attributed to an increase in new and commissioned facilities, partially offset by economic offloading and network curtailment.
New South Wales secured the most significant increase in grid-scale solar PV generation YoY compared to other states in the NEM, recording an average growth of 141MW, a 14% increase.
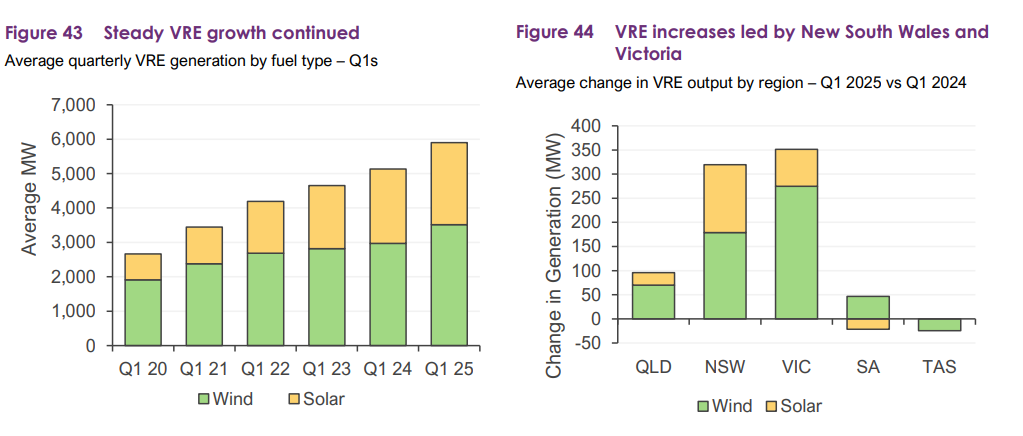
The growth in generation in New South Wales was primarily driven by several notable solar PV power plants, including the Wellington North and Walla Walla solar PV power plants, which have a generation output of 121MW and 89MW, respectively.
The impact of curtailment and economic offloading
In contrast, higher levels of network curtailment and economic offloading in all regions except Victoria collectively reduced the average grid-scale solar generation output by 124MW this quarter compared to Q1 2024.
Economic offloading, which increased by 112MW, was primarily responsible for this change, reflecting the rising incidence of negative prices across the NEM.
Queensland saw the largest increase in economic offloading, rising by 50MW, followed by New South Wales with an increase of 49MW and South Australia with an increase of 31MW. In New South Wales, network curtailment also grew significantly, rising by 23MW this quarter. Conversely, in Victoria, both network curtailment and economic offloading decreased, falling by 14MW and 18MW, respectively.
The reductions in output due to increased economic offloading and network curtailment more than counterbalanced a slight rise in the energy available from existing solar facilities in the first quarter of 2025.
As a result, NEM grid-scale solar’s overall net output increased by 221MW, 100MW less than the increase in availability from new and commissioning facilities.
Violette Mouchaileh, the executive general manager of Policy and Corporate Affairs at AEMO, said that the expansion of renewable energy and battery energy storage systems (BESS) capacity in the NEM is leading to higher contributions. Meanwhile, the availability of black and brown coal-fired generators has reached record lows for the first quarter.
“The impact of the transitioning electricity system was also seen, with a 5.1% decline in total emissions, due to the combination of lower coal and gas-fired generation and higher renewable energy output,” Mouchaileh said.
“The higher renewable energy and battery generation combined with lower coal-fired power output resulted in a Q1 record low in emissions intensity, which was 5.7% below the same period last year.”
Last week, PV Tech Premium analysed the generation of utility-scale and rooftop solar PV in the NEM and Western Australia’s South West Interconnected System (SWIS) during April.
According to the data, which had been sourced from Open Electricity, formerly known as OpenNEM, solar generation in the NEM was up 13% year-on-year. Indeed, utility-scale and rooftop solar PV generation hit 3,440GWh in April, slightly lower than the 3,859GWh recorded in March 2025, a decrease of 419GWh month-on-month. This generation capacity supported the growing number of renewables in the electricity mix.
Q1 2025 BESS output surges 86% YoY in Australia’s NEM
Alongside a growth in generation capacity for solar PV, BESS also had a successful start to the year, recording an output increase of 86% YoY.
BESS generation output reached a new all-time high this quarter, increasing to an average of 98MW, spurred by new capacity entering the market.
This BESS output was concentrated strongly in the evening peak period, often when solar PV generation begins to decrease. This typically begins at around 17:00 and ends around 21:00. You can find a breakdown below.
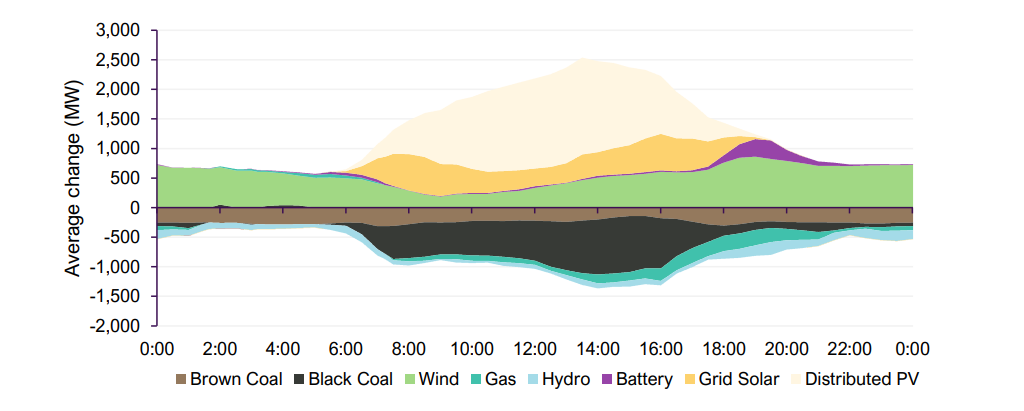
The amount BESS contributed to the overall electricity mix remained minimal, standing at 0.4% for Q1 2025. However, this was still a 50% increase on the previous year, when it stood at 0.2%.
Much like the case for grid-scale solar PV, the increase in BESS output has been attributed to the increase in large-scale systems reaching full operation or undergoing commissioning since Q1 2024.
This includes the 255MW/510MWh Western Downs BESS in Queensland, the 850MW/1,680MWh Waratah Super Battery in New South Wales, the 200MW/400MWh Blyth BESS in South Australia, and Rangebank, a 200MW/400MWh system in Victoria.
Utility-scale solar PV generation and BESS are leading the applications for the financial year to date. However, despite seeing a rise in announced solar-plus-storage projects in Australia in recent months, these are still minimal and have not been shared across most states, focusing more on New South Wales and Victoria.
Parts of this article were first published on Energy-Storage.news.


