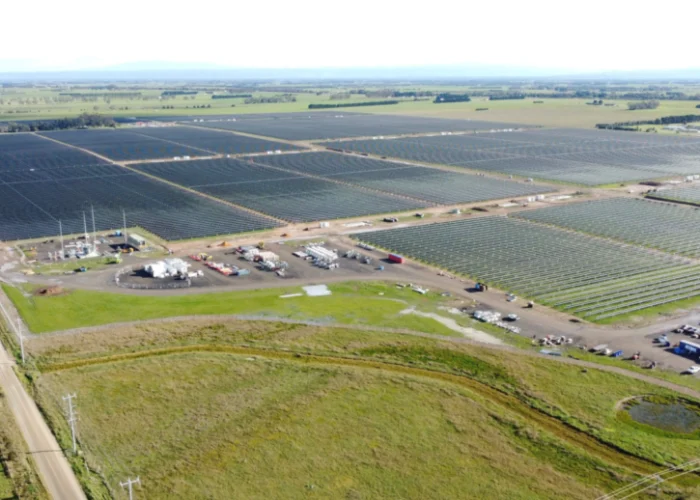

April 2025 saw solar PV generation, both rooftop and utility-scale, decrease marginally month-on-month in Australia’s National Electricity Market (NEM) by almost 11% as the country transitions from its summer to autumn period.
Australia’s NEM covers South Australia, Tasmania, Victoria, New South Wales, the Australian Capital Territory and Queensland. It is predominantly oriented towards a baseload power grid comprising mainly coal generators.
Try Premium for just $1
- Full premium access for the first month at only $1
- Converts to an annual rate after 30 days unless cancelled
- Cancel anytime during the trial period
Premium Benefits
- Expert industry analysis and interviews
- Digital access to PV Tech Power journal
- Exclusive event discounts
Or get the full Premium subscription right away
Or continue reading this article for free
According to the data, which has been sourced from Open Electricity, formerly known as OpenNEM, which aims to make NEM and Wholesale Electricity Market (WEM) data more accessible to a wider audience, utility-scale and rooftop solar PV generation hit 3,440GWh in April. This figure is slightly lower than the 3,859GWh recorded in March 2025, a decrease of 419GWh.
However, despite the shortcomings on a month-to-month basis, April 2025 saw strong growth in generation capacity compared to April 2024. Indeed, utility-scale and rooftop solar generated a combined 2,975GWh across the month, 13.6% lower than April 2025’s recorded generation. Below is a full breakdown of monthly solar generation in the NEM on the graph, exclusive to PV Tech Premium subscribers.
As seen above, December 2024, the peak of the Australian summer, had the strongest solar PV generation recorded in the NEM in the past 12 months, followed by January. In December, Australia experienced warmer-than-average temperatures nationwide with a national area-averaged mean maximum temperature 2.27 degrees Celsius above average, making it the second warmest on record.
This continued into January 2025, when the country witnessed its second-warmest January since records started. The average temperature for the month was 20.78 degrees Celsius, which is 0.47 degrees Celsius above the 1991-2020 average. Major cities, such as Sydney, had a mean daily maximum temperature of 27.0 degrees Celsius and a mean daily minimum temperature of 19.7 degrees Celsius.
The result saw strong solar generation throughout these two months, with December seeing solar generate 5,213GWh and January seeing solar generate 5,039GWh.
Utility-scale solar PV generation reached 1,402GWh in April, and rooftop solar PV reached 2,038GWh. This is higher on both accounts’ year-on-year, with utility-scale solar generation reaching 1,204GWh in April 2024, whilst rooftop solar PV reached 1,771GWh.
17 April the strongest day for utility-scale and rooftop solar PV generation
Over the month, 17 April saw the strongest solar generation, at 137GWh, with 7 April coming in second with 133GWh.
On 17 April, utility-scale solar generated 59GWh, more than the 51GWh generated on 6 April. Meanwhile, rooftop solar generated 78GWh on 17 April, lower than 7 April’s figure of 82GWh.
The distribution of daily solar generation across April 2025 is shown in the graph below, rooftop solar PV generation remains significantly higher than utility-scale solar. Notably, on 2 and 20 April, rooftop generation exceeded utility-scale solar by more than double.
For utility-scale solar, the lowest point for generation was on the 2 and 20 April, when it reached 31GWh. In contrast, the best days for utility-scale solar PV generation were the 8 and 17 April, both coming in at 59GWh. The average generation across the month of April stands at 46.6GWh.
For rooftop solar, which last year surpassed coal-fired generation on the NEM and recently hit 25GW, the strong generation figures reflect a market that continues to move from strength to strength.
The peak of rooftop solar generation across the month came on 5 April, with 89GWh. The next highest was on 7 April, with 82GWh, whilst the 17 and 18 April came joint-third with 78GWh each.
In contrast, the lowest rooftop solar generation days came on 25 and 27 April, when it stood at 47GWh. The joint second-lowest generation days also came during this week on 26 and 28 April, when it reached 53GWh. Despite these being the lowest days for rooftop solar generation, this is 6GWh higher than the best days for utility-scale solar generation on the NEM.
Rooftop solar dips into negative pricing on eight days
Coinciding with the available generation statistics, average daily valuations of rooftop and utility-scale solar PV fluctuated throughout the month.
The average price for both technologies peaked on the same day, 9 April, with utility-scale solar seeing an average of AU$87.64/MWh (US$55.9/MWh) whereas rooftop solar saw an average of AU$91.56/MWh.
This is the same day utility-scale solar generated 50GWh and rooftop solar PV generated 73GWh in the NEM.
Interestingly, both utility-scale and rooftop solar saw days when the average price dipped into the negatives. This can be due to a multitude of factors. However, as noted on our sister site, Energy-Storage.news, it can often be caused by generation creating a surplus in the middle of the day, which means that project and portfolio owners have to pay people to take their energy.
Tim Buckley, founder and director of the think tank Climate Energy Finance, said at the Energy Storage Summit Australia 2025 in Sydney in March 2025 that in the states of Victoria and South Australia, negative pricing was experienced for 24% and 26% of last year, roughly four times higher than experienced in European power markets.
Utility-scale solar average prices dipped into negative pricing on 6, 18 and 20 April, whilst rooftop solar PV hit negative price averages on 5, 6, 13, 18, 19, 20, 21 and 22 April.
The biggest negative pricing for utility-scale solar energy occurred on 6 April, when it reached -AU$3.41/MWh. This happened on the same day for rooftop solar PV, with average prices reaching -AU$17.47/MWh.