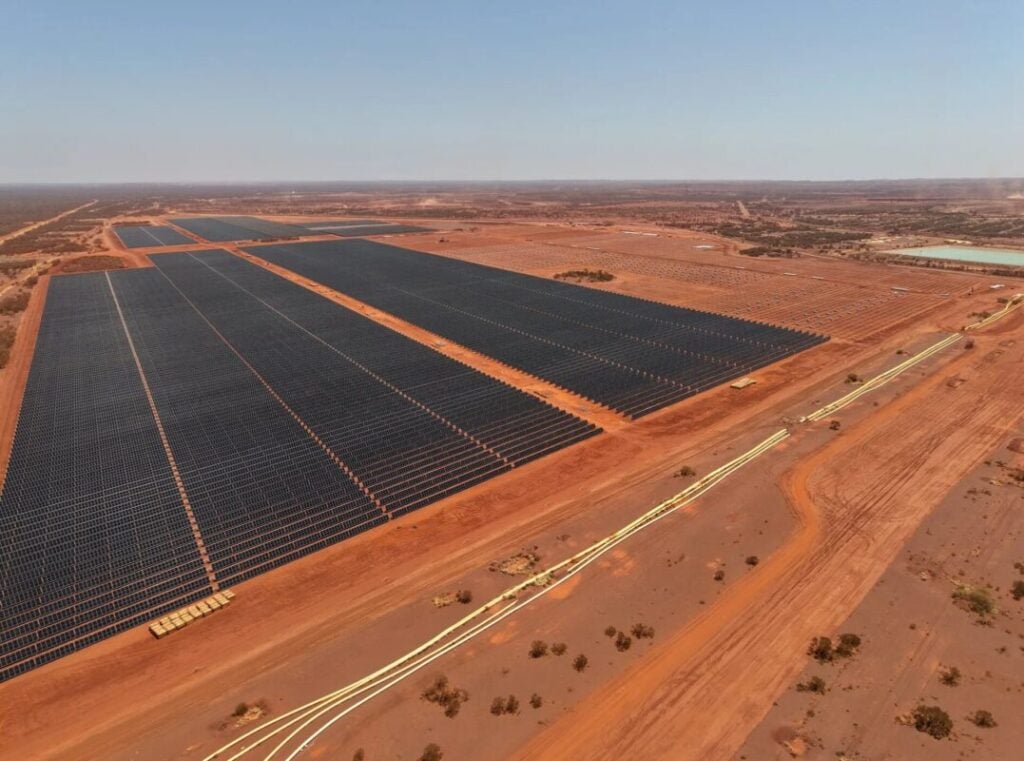
Australia’s large-scale renewable energy pipeline has reached 32,277MW of probable generation capacity, according to the Clean Energy Regulator’s pipeline tracker.
The CER’s pipeline data, updated weekly, categorises projects as probable once they publicly announce a financing source, such as signing a power purchase agreement (PPA) or winning a Capacity Investment Scheme (CIS) tender.
Try Premium for just $1
- Full premium access for the first month at only $1
- Converts to an annual rate after 30 days unless cancelled
- Cancel anytime during the trial period
Premium Benefits
- Expert industry analysis and interviews
- Digital access to PV Tech Power journal
- Exclusive event discounts
Or get the full Premium subscription right away
Or continue reading this article for free
On 29 May, the probable queue jumped by 8,315MW in a single week, from 23,962MW to 32,277MW, which has been recorded as the largest seven-day movement in nine years of data.
The addition almost certainly reflects the registration of CIS Tenders 5, 6 and 7 awards into the dataset, which together allocated more than 10GW of renewable energy capacity across the National Electricity Market (NEM) and Western Australia.
CIS Tender 5 awarded 1.9GW of generation capacity in Western Australia alone, while Tender 7 awarded a further 7.8GW of renewable energy across the NEM, with wind dominating the results at more than 7GW of the total. Meanwhile, CIS Tender 6 saw 3,683GWh of standalone battery energy storage added.
The combined weight of these awards, entering the CER’s probable category simultaneously, produced the spike visible in the weekly data.
The 32GW probable figure is the cumulative result of successive CIS tender tranches loading the pipeline over the past 18 months.
The probable queue stood at roughly 13,600MW in mid-2025, jumped to just over 20,000MW in October 2025 following earlier CIS awards, and has nearly doubled again following the registrations for Tenders 5, 6 and 7. Each step up corresponds directly to a tender round outcome entering the tracker.
A growing gap between probable and committed
What the data also shows, with equal clarity, is that the committed queue has not kept pace.
Committed projects, which are those that have reached a final investment decision or publicly announced the start of construction, stood at 7,354MW on 29 May, up modestly from around 5,600MW in mid-2025 but still well below the pace needed to match the inflow of new probable capacity.
The gap between the probable and committed categories now stands at approximately 24,900MW – the widest in the dataset’s history by a substantial margin.
That gap reflects a structural challenge that has been building since the CIS programme began generating large tender outcomes.
Projects enter the probable category when they win a CIS contract, but moving from contract award to financial close requires grid connection agreements, state and federal planning approvals, financing arrangements and in many cases, offtake contracts beyond the CIS revenue floor.
Each of those steps takes time, and the CIS pipeline has been growing faster than the machinery that converts contracts into construction starts.
The accredited fleet, noted as projects that have been commissioned and are generating electricity, stood at 29,542MW as of the week ending 31 May 2026, having grown from approximately 24,000MW in early 2024.
That growth reflects the commissioning of projects that entered the committed category during the 2022 and 2023 investment surge, when the committed queue peaked at around 8,000MW.
The current committed queue, at 7,354MW, is below that 2022 peak despite a probable pipeline that is now four times larger.
The CER’s own modelling, published in its December quarter 2025 market report, projected that between 6-16GW of capacity could reach a financial investment decision by the end of 2027, a range that reflects the uncertainty around how quickly the current probable pipeline will convert.
The CER noted that 12GW of CIS-supported generation from the first four tenders alone had yet to reach final investment decision (FID) at the time of that report, before the Tender 5, 6 and 7 outcomes added further volume to the queue.
The scale of the probable pipeline provides a degree of insurance against individual project attrition. Historically, not every project that reaches probable status converts to committed, and the CER’s pipeline has always included a proportion that stall or are cancelled before reaching construction.
With the probable queue now at 32GW, the volume of capacity available to convert is larger than at any previous point, which gives Australia a deeper buffer against the delays and cancellations that are a routine feature of large-scale renewable energy development.
Whether the current committed queue of 7.3GW is sufficient to keep pace with coal retirements and meet the federal government’s 82% renewables by 2030 target is a separate question.
You can explore Australia’s monthly solar generation performance in our NEM Data Spotlight series, with all entries available to PV Tech Premium subscribers.


