Everything seems to be pointing to the solar PV manufacturing sector going into a downturn in 2024, with loss-making potentially rife across much of the upstream sector.
In this article, I explain why this looks like the most likely landscape for the industry next year; why the current round of module supplier gross margin highs is possibly a red herring; what factors may come to the industry’s rescue to avert this situation; and the chances of these actually stopping the first major downturn seen in the industry since 2013-2014.
Try Premium for just $1
- Full premium access for the first month at only $1
- Converts to an annual rate after 30 days unless cancelled
- Cancel anytime during the trial period
Premium Benefits
- Expert industry analysis and interviews
- Digital access to PV Tech Power journal
- Exclusive event discounts
Or get the full Premium subscription right away
Or continue reading this article for free
And to round things out, I suggest possible groupings that could stand to benefit from a PV manufacturing downturn next year.
Downturn was poised to start in 2020 but got delayed
Technology and manufacturing segments are hard to forecast. But one thing is certain: fortunes cycle. After any prolonged upturn, there will almost certainly be a downturn that acts as a reset and sees the business plans of many thrown into touch.
The solar PV industry is no exception. In fact, one could say it is an extreme example of this phenomenon, given its reliance on government policies, energy sector benchmarks and its survival based upon assumptions underlying a transition to a green economy.
Since 2016, PV manufacturing has witnessed a bounty period: times when positive margins (however tight) were never massively in doubt, at least for the major top ten across the manufacturing value chain. Investments in new capacity could be made with minimal risk; the investor community had a decent amount of confidence in the near-term earnings potential of listed companies; and companies could plan for technology upgrades and changes without any great fear of new product rejection.
Looking back, the big surprise is that this upturn phase has actually lasted so long; about eight years to be exact. This is truly an age in the solar industry.
In gathering data to support the 2024 outlook, during the past few weeks ahead of this article, I went through endless attempts to find one magic graph that showed conclusively that what is happening today mirrors the final phases of the last prolonged upturn within the industry that came crashing down in 2014 when Europe effectively ‘turned off’ its feed-in-tariffs; just as China had pressed the button on massive expansions (the 1GW factory days) to ship modules to Europe.
I went through dozens of spreadsheet calculations. Tracking accounting ratios against manufacturing metrics, such as shipments, overcapacity, inventory, capex and end-market demand. Ultimately, I gave up. I concluded that doing a meaningful comparison of the PV industry in 2013 to 2023 was basically like comparing apples and oranges. However, there are some key indicators that are generic, and I discuss them later.
However, in doing this exercise, it hit me that the upstream manufacturing sector really should have gone into a downturn phase about two years ago but was saved only by two factors that no one had been expecting; especially the manufacturers themselves that try desperately to look at what their sales environment is going to look like two to three years down the line.
Before I explain these two factors – and introduce a single graphic to explain this – let me quickly explain what ‘downturn’ actually means, as it is a phrase that instantly creates panic in many, but in reality has a share of winners and losers in the short term.
First, everything I am commenting here is specific to an upstream downturn; something that is confined to manufacturing of modules, their sub-components (cells, wafers, ingots, polysilicon and the other technology that is ultimately coupled to module sales levels: thin-film); and materials and equipment suppliers that benefit from continued investments and profitable manufacturing.
Downturn – in my frame of reference – represents a situation where manufacturers struggle to make product at-cost, generally operating net-negative, and put the brakes on variable costs that can be controlled, in particular capex and R&D spending. It also overlaps with the inevitable consequence of this operating environment wherein producers focused on pure-play activity in the ‘midstream’ (for c-Si manufacturing, this being wafers and cells) get squeezed almost into oblivion by their suppliers and customers (normally polysilicon and module dominant entities); see the Taiwan case study of yesteryear.
Now let’s look at the two factors that I think have simply delayed this downturn inevitability, before I explain how I think the probable downturn will play out in 2024.
The graph below sets the stage here.
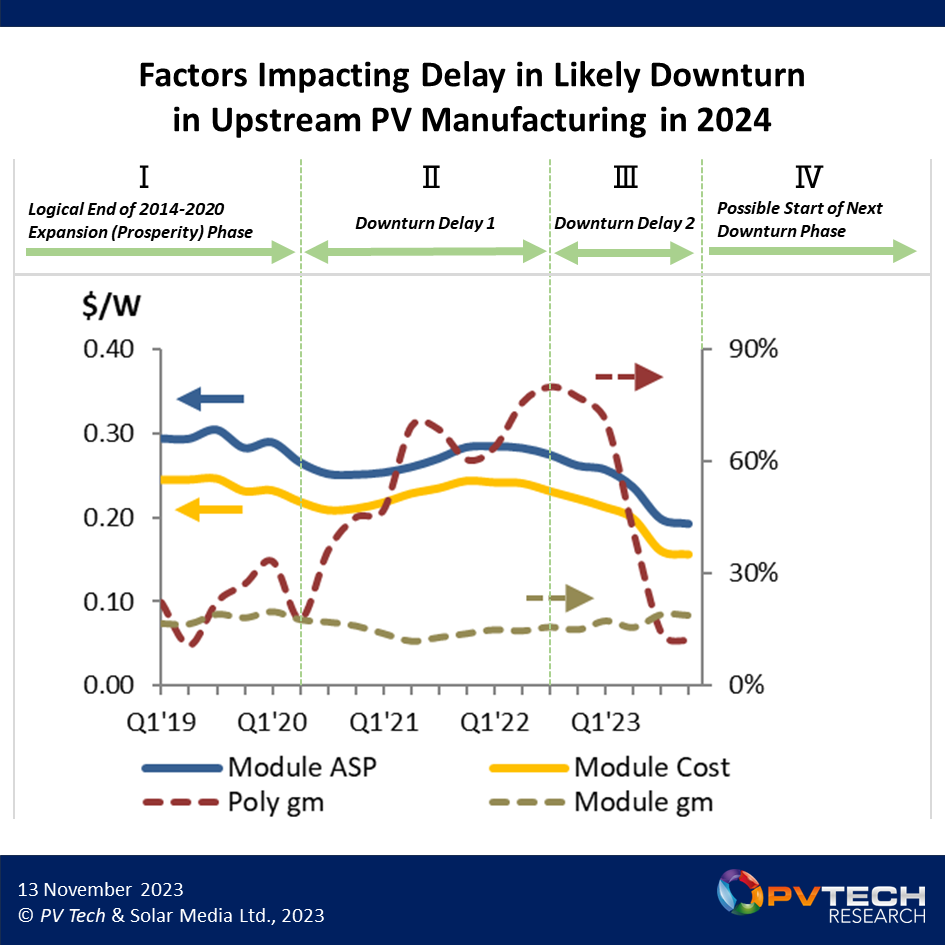
The graph above looks quite busy, but it is showing a bunch of things, so let’s break it down step by step.
I have basically plotted quarterly trends (from Q1’19 to the end of Q4’23 that is forecasted) of module blended global average sales price (ASP) and costs (all-in module, silicon and non-silicon), as shown in the thick lines (blue and yellow, respectively) with values shown on the primary (left) vertical axis in US$/Watt ($/W). This is based on best-in-class global module supplier status (basically one of JinkoSolar, JA Solar, Trina Solar or Canadian Solar in this case).
Taken in isolation, there is nothing major to report here, until we get to 2H’23 (now) as we see both module ASPs and costs taking a rapid downward plunge.
The other metrics shown on the graph are the gross margins of best-in-class (Chinese) polysilicon production and module supply (from the above grouping of leading Chinese companies). In the case of the polysilicon values, this is specific to Daqo. Gross margins are production margins or the percentage profit less cost-of-goods-sold (COGS) and are specific to module revenues/operations (as opposed to overall group margins that may have other revenue streams).
The gross margins are shown by the dashed lines; red for polysilicon production and brown for module supply. These margins (in percentages) are tracked on the secondary vertical axis (the right side).
Overall, if one was only looking at the module gross margin, one may be inclined to think that nothing much had changed over the past five years! And in fact, that module gross margins were actually going up now to levels in the high teens. Oh, how totally misleading this conclusion would be! More on why this is the case later.
The stand-out variable from the graphic above is, of course, the gross margin of Daqo (polysilicon). This is truly rollercoaster territory, reaching preposterous highs at the 80% level in 2022. Again, looking at this in isolation would not provide any real conclusions about a widespread PV manufacturing downturn looming in 2024: only that, for a while in 2022, polysilicon suppliers had hit a purple patch.
To put these four tracked metrics in context of the 2024 prediction of a likely PV manufacturing downturn, it is necessary to take a step back. To do this, I have broken out the past five years into three time periods, each of which had different factors impacting the manufacturing segment.
Three-year delay to downturn – why?
In Figure 1 (see the text along the top), I have put the period from 2014 to the start of 2020 (covered quarterly here in terms of metrics from Q1’19) as Phase I. This covers the period from the end of the last downturn phase (about two years duration) that impacted the PV industry during 2012 to 2013.
When the industry was expanding capacity and growing during 2019, it was probably set for the start of a downturn (not necessarily a severe and chronic type) in 2020. This would have been a logical reset were it not for two separate issues, that are outlined in Phases II and III in the graphic above.
Phase II covers the period from Q2’20 to Q3’22. I have called this ‘Downturn Delay 1’. During this period, the solar industry changed direction. In short, end-market demand skyrocketed; renewables and climate change became real issues globally, and everyone wanted solar tomorrow. The bottleneck in supplying modules was polysilicon availability. Polysilicon prices increased dramatically and this explains the polysilicon gross margin (Poly gm above) rise (for Daqo here) from about 15% at the start of 2020 to over 75% at the end of 2022.
Normally, this increase in polysilicon pricing would have had a profound impact on module suppliers’ margins (through the three to fourfold increase in polysilicon costs), but as seen above, during this Phase II period, module supplier margins (at least from the major Chinese global suppliers) barely flinched. This is because the demand for solar was way beyond supply levels and module suppliers were able to bump up module ASPs. In short, both module costs and ASPs went up almost in alignment, keeping (Chinese best-in-class) margins fairly constant at the circa. 15% level.
During this period, it was very much a module seller’s market: to such an extent that stories abounded of module suppliers routinely tearing up legacy supply deals overnight because they could re-sign them ten times over at higher ASPs with other customers the next day.
The period from Q2’20 to Q3’22 had no real longevity to it. It was surely going to come tumbling down – but when?
Towards the end of 2022, this indeed started to happen. The reason for this was because huge amounts of new capacity came online in China all across the value-chain. Not simply from new entrants, but from existing producers (such as Daqo) that were in effect adding excess capacity to potentially erode their own margins.
Now we are in the Phase III period above (Downturn Delay 2, as I call it).
No end-market in any technology segment can adjust to a 30-40% excess in supply tomorrow, not even solar PV. And so virtually overnight, the industry became a buyer’s market and polysilicon pricing collapsed. This comes over in the rapid decline in Daqo’s gross margin from Q3’22 to the end of 2023. For Daqo, this is not a problem, as having the lowest cost structure is a massive help. For other polysilicon makers, it signals danger. Western suppliers in the absence of US-bound module pricing upticks face the prospects of returning to the bleak period that characterised sub-US$10/kg polysilicon pricing a few years ago.
From Q3’22, module ASPs have been in freefall, and especially during 2H’23, taking us into a new world of sub-US$0.2/W module pricing (global ex-US for now) being the norm.
But yet, module gross margins looked like nothing chronic was going on behind the scenes. The reason for this is that costs were coming down as fast (sometimes even quicker) than module prices were coming down. And all this cost reduction was coming from lower polysilicon prices, not through any major changes in production costs for making ingots, wafers, cells or modules (explained in more detail shortly).
If you look at the graph above, this is borne out by noting that the module margins in 2H’23 are now above Daqo’s polysilicon margins.
So, again, the downturn in manufacturing was avoided, purely because the cost of polysilicon fell by more than the decline in module prices.
But now, this gets us to a situation where there could be no more ‘Get Out of Jail’ cards on the table for module suppliers. And this is why I think from the start of 2024, it is highly likely the PV manufacturing segment goes into the next downturn – unless there is something else that delays this.
Prices still falling but costs have almost nowhere to go
Currently, module prices are still falling. This is due to over-production, over-supply and inventory build-up across two of the leading end markets today: Europe and the US. End-market demand is not a binary switch that can simply be turned on by shipping copious amounts of product to regions or by dumping prices in the hope that some kind of magical demand elasticity is triggered.
Indeed, this final point appears to be the hope of many module suppliers today that are banking on this being their salvation in 2024. One can see their rationale to an extent. Land tens of gigawatts of product at pricing circa. US$0.15/W and projects – hitherto uneconomical – will spring into life. If only life was that simple. The reality is that utility-scale projects (that are essential to consume this level of volume) normally progress on timescales driven by planning, consenting and grid-availability issues. While a few cents here or there on module pricing obviously helps, it is rarely if ever the single factor that will allow a project to be brought forward 12-18 months ahead of its natural build-out schedule.
Therefore, it is entirely reasonable to assume that pricing is going to continue to fall for the next six months, at a minimum. Some markets, or segments of these markets, will retain pricing resilience to some extent; for example, institutional-financed US utility projects that demand Western polysilicon and full wafer-to-module manufacturing outside China. Or projects that signed module supply contracts last year at much higher prices and where the buyers are hesitant to renegotiate or revisit alternative module offers at a lower price.
The timing is also not suggesting a module price uptick. The start of the calendar year is notorious for seeing a sharp price fall each year, and 2024 should be no different as China itself is by far the dominant end market for shipments globally and has displayed classic calendar year-end resets in the past (where demand falls rapidly and pricing goes down on the back of factory productivity adjustments).
From a pricing perspective, sadly things get worse still.
If the number of manufacturers largely remained static, such a crisis could be averted by each of them adjusting production and supply to get inventory under control. Unfortunately, this has never been a strength of Chinese manufacturing ideology.
Even when there was a glaring opportunity for leading polysilicon producers in China to agree among themselves (in a cartel-like mode) to limit supply to keep pricing strong, they acted in the other direction; each continuing to bring on new polysilicon capacity, striving for maximum output at all times, obsessed by market-share gains, and ultimately doing little more than being responsible for eroding their own margins.
And this is even before we consider new entrants to the sector, all in this case Chinese-owned companies also.
If there was a deliberate plan to lure other domestic competitors (or overseas aspirants) into the space by allowing pricing to hit profit-busting highs, only to then be responsible for crashing pricing down to make them uncompetitive overnight, then hats off to them! However, in this case, I suspect I am giving everyone a bit too much credit! This would require collective (or cartel-like) thinking and I do not think this really goes on to any great degree in China today.
The situation as it relates to oversupply of modules, when considering excess capacity to pull ingots, slice wafers, fabricate cells and assemble modules, is actually out of control in China today. And this probably worries me more in terms of there being anything to stop 2024 being loss making for the upstream segment.
For the past few years, countless new entities in China have come into the value chain, building new 10-20GW fabs at the drop of a hat. Companies with no industry knowledge or background, no technical expertise, and no customers lined up to sell products to. In any industry, this is a recipe for disaster.
And even as inventory has been building up in recent months and pricing has been in free fall, yet this obsession with PV manufacturing activities continues in China.
Aligned with a 100% domestic equipment supply chain, equally obsessed with growth on the back of IPOs and listings in China, the backlog of me-too c-Si factories in China makes silly reading today. Equipment suppliers citing tool backlogs in excess of 500GW being just one example of a Chinese manufacturing sector that almost seems hell bent on self-destruction.
In the following section, I forecast a likely price and cost trajectory, and when this may finally cause the penny to drop that changes need to be made in terms of investment decisions (in particular capital expenditure, or capex).
Break-even operations by mid-2024?
The graphic in Figure 2 below shows one possible trajectory during 2024, assuming a range of factors, each of which may not happen of course. Please remember this is one possible outlook, and there are many others depending on what you assume the PV world will look like in 2024. And there is what we simply don’t know today about the future (as was the case with a pandemic and a war in Europe over the past few years).
But here we go for my most-likely summary of 2024 from a PV manufacturer’s perspective. The key metrics are again tracked in the graphic below to support the narrative.
Forecasting price is almost impossible. No one has got this right in the 20 years I have been looking at the PV sector. There is always something that happens which nobody expected. Or some irrational selling (for example at huge loss) or buying (for example at any price) which could not have been known.
Therefore, I will keep things really simple here. I am going to assume that pricing (as reported by the leading Chinese module suppliers and blended across all end markets as an average delivery-duty-paid number in US$/W) declines from levels today (circa. US$0.18-0.19/W blended) to US$0.14-0.15/W at the end of 2024. While there will be seasonality during the year that cannot be predicted right now, I simply work on the basis of a linear fall during this time period. For the following analysis, this is more than good enough.
The key point here is that this forms a baseline against which to consider a possible cost trajectory, which is actually easier to forecast than price.
For a vertically integrated c-Si module supplier (making some or most of its own ingots, wafers, cells and modules), there are five key cost elements that contribute to module profitability (or loss). For the analysis below, I am going to consider the absolute lowest-cost situation. If the lowest-cost vertically integrated players are loss-making, everyone else is only in a worse situation.
Polysilicon costs are based on buying from another company (say Daqo, for example) that has a baseline cost and wants to make a margin. Ingot, wafer and cell are each a zero-sum game; all that needs to be considered are the production costs, not a delta coming from having to be profitable. Module assembly has a production cost (the highest across the value chain today) and this is where the final margin (profit/loss) is coming from based on these companies only selling modules as a source of company turnover.
In the absence of short-term pricing fluctuations for raw materials (for example silver or glass), or any consumables whose pricing is out of the control of the PV industry, it is a relatively simple task to forecast ingot-to-module costs forward 12 months. There is 15 years’ of data and trends to support this.
Is there an industry cost learning curve?
During this part of the research, I decided it was high time to look at costs in the c-Si value-chain in a way that I had been wanting to do for about ten years; specifically, to see at what rate non-silicon costs were really coming down each year. At the back of my mind here was the PV industry’s established ‘learning curve’ – a graphic I must have viewed a thousand times in the past and seen discussed so often.
Each year, the International Technology Roadmap for Photovoltaic (ITRPV) report is released. It is an invaluable reference compendium of PV (almost exclusively c-Si) metrics and graphics across the key parameters tracked in manufacturing. And one of the most referenced graphs in the ITRPV report is the so-called ‘learning curve’, that tracks the PV industry’s (average, blended) module ASP each year as a function of the cumulative PV installed base (on a log-log basis). It is based on the assumption that module ASP declines annually based on the cumulative learning of the sector as a whole, as the overall size of the installed base increases.
Generally, the findings are stimulating – but module ASPs tend to have numerous determining factors (such as policy and over/under-capacity). It is debatable if cumulative installed PV levels are the best means to track annual ASP declines. Is the pricing coming down (or changing) each year because of the size of the cumulative installed base in place already?
For a long time, I have thought that the comparison should be annual c-Si costs (less polysilicon) against annual c-Si production. This should show ‘learning’ more clearly from a cost standpoint. Given the current questions around a possible downturn in 2024 (and a potential flattening/bottoming-out of polysilicon costs/prices), how close are we to the production/processing costs of making ingots, wafers, cells and modules being limited simply by the major materials costs involved (such as silver and glass)?
The graphic in Figure 3 shows (I think for the first time I know about) a learning curve for cost reduction of c-Si module production (less polysilicon) as a function of the c-Si annual production level, spanning the period from 2013 to 2023.
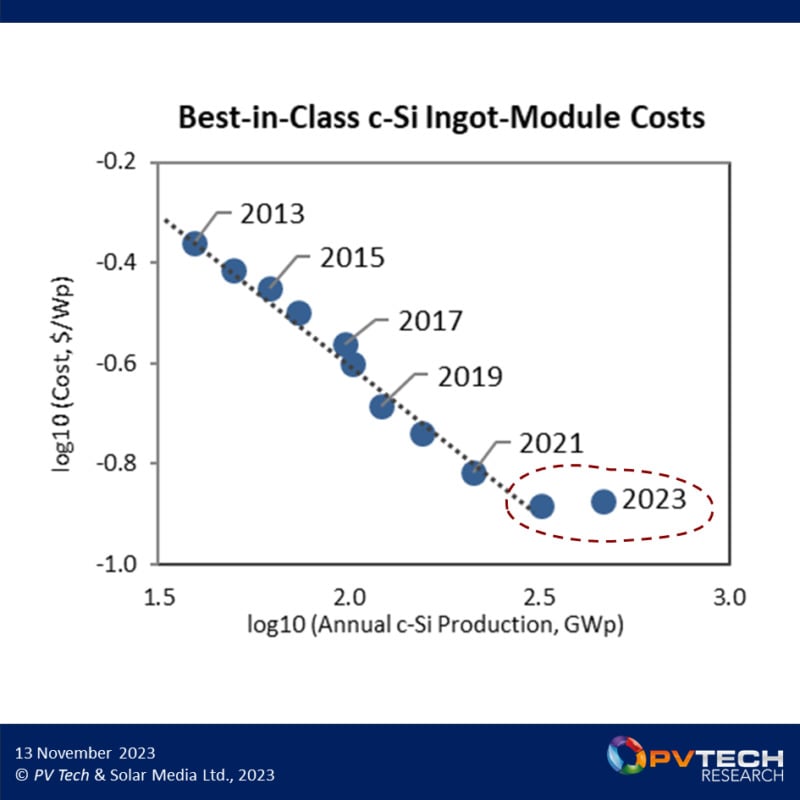
Looking at Figure 3 in detail, non-silicon (ingot to module) costs can be seen to decline annually, going ten years back. Any further back is not of great interest because it is during the last ten years that Chinese vertically integrated players have been setting cost standards that have fed into global benchmarks for the industry as a whole.
Were it not for the 2023 data point, the graph above could suggest that there was some kind of permanent relationship between the level of annual c-Si production and how low non-silicon costs could go. But of course, this cannot be true: at some point, baseline costs become a consequence of the consumables bought in, many of which are beyond the control of the PV sector: no matter how cheap labour and electricity costs are at any given time in China or across Southeast Asia.
The deviation from the fit in 2023 is perhaps the first signal in years that a new push needs to come from Chinese c-Si manufacturers to reduce costs further. During 2023, the need to reduce (non-silicon) costs was not a priority, mainly because silicon costs were coming down so much and mid-to-high teens gross margins at the module level were able to be maintained.
Indeed, during 2023, the main variable in cost reduction (silicon plus non-silicon) was the cost (sales price) of polysilicon, as shown clearly in an earlier graphic in this article. In 2024, I assume that companies such as Daqo (and for much of the Chinese polysilicon sector) will sell at lower pricing than today, but not at levels that threaten operational loss-making in any major way. For argument’s sake, I project poly ASPs through 2024 based upon 15% gross margins (for the polysilicon suppliers), and then factor in g/W trends in order to back out the final costs seen by the module suppliers for their polysilicon purchases.
This all leads to questions about 2024 (and 2025) cost-reduction activities, assuming of course that a manufacturing downturn does kick in next year. During the last downturn, the Chinese sector made huge strides in cost reduction by largely setting up a near-100% country-specific materials and equipment ecosystem for silicon-based PV manufacturing. Glass got thinner; silver lines got thinner; larger fabs got built with automation; and supplier margins got squeezed in order to align with the greater Chinese manufacturing model of dominance.
This time around, this ‘trick’ can’t be deployed because it is essentially done and in place. Surely glass cannot – or should not – be reduced in thickness? Is it time to shave another 20-30 microns off the thickness of wafers? Can either of these be done without an immediate impact on module quality in the field? So many questions today, awaiting to see how the Chinese sector reacts to having to focus once again on squeezing out costs from an already streamlined manufacturing ecosystem.
Understanding the 2024 forecast
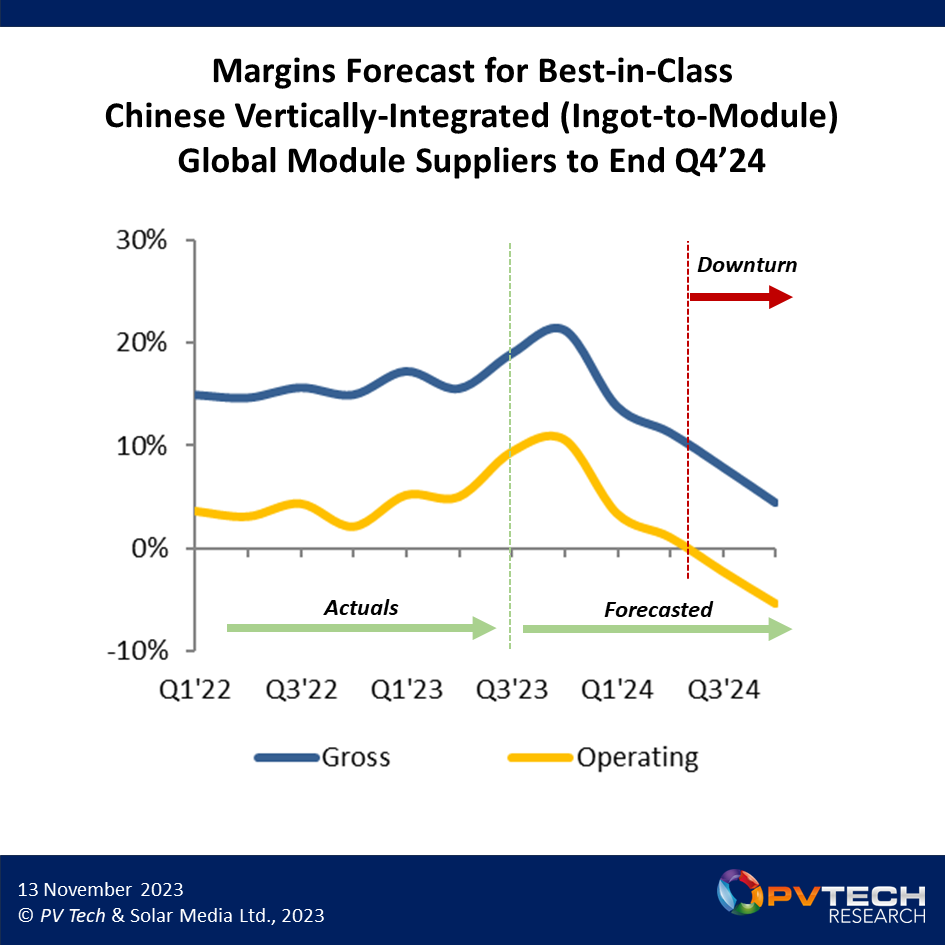
Therefore, the underlying factors for 2024 may be very simple. Module prices keep falling, but polysilicon prices bottom out with polysilicon suppliers (best-in-class) being able to hold out at 15% gross-margin levels. Module suppliers (again best-in-class) have limited options to reduce costs to keep up with module price declines. Any declines in wafer and cell processing costs are minimal.
By the middle of next year (2024), module supplier gross margins would then decline to levels that push operating margins into the red. With limited scope for a module pricing rebound (with the industry still being in over-supply mode), we are now officially in a downturn phase of the industry (in terms of manufacturing).
However, to finally call this a downturn, it will need to be matched by steep capex declines and the cancellation of new fabs currently under construction (or planned to get built in 2024-2025), the mothballing of half-completed fabs, and the equipment backlogs of Chinese tool suppliers largely wiped out overnight (de-booked). Only if these things happen in 2024 will we truly have a manufacturing downturn.
Now for the more interesting part of this article: what would need to happen to prevent, or simply delay, the (inevitable) manufacturing downturn cycle? I discuss this in the next section, before returning again to capex ahead of my final thoughts.
Is there something else that could delay the downturn?
There are plenty of things that could happen in 2024 to prevent a manufacturing downturn. Some of these are plausible, some are irrational, and some are aspirational.
The first one to consider is a module price rebound, back towards (and north of) the US$0.2/W mark. This could happen if there is an amazing and almost instantaneous demand elasticity uptick. The sub-US$0.2/W modules miraculously unlock 2024 demand just waiting for cheap modules to break ground. Possible, but to be honest, unlikely to happen in time. If anything, there could be an uptick in residential applications, but even then, it is interest rates and cost of capital today that is holding back this sector, not cheap modules.
The supply/demand balance could also change if there was an outage at one the major polysilicon suppliers, in China or elsewhere. This has happened in the past on several occasions and is always a risk given how the nature of polysilicon plants.
Next up, costs come down greater than expected. Given that the scope for this to happen for ingots, wafers and cells is limited (as discussed earlier), then this all comes down to polysilicon. But as noted above also, even the lowest cost producers in China are struggling to make anything north of 15% gross margin today.
But let’s imagine that the likes of Daqo decide they want to make at break-even status, or even at a loss – just to help the module guys stay profitable! It would certainly be an interesting one to destroy competition (if you can absorb losses for a year or so), but it only works if you are certain you can put pricing up later and this is far from a given in the PV industry (especially when it comes to polysilicon pricing).
However, there is another variant of this (loss-making) that could help the module supplier community in 2024. So far, the analysis above assumes that the lowest module costs come from having in-house manufacturing of ingots, wafer and cells (and that each of these is a zero-sum-game).
Obviously, a fully integrated module supplier is not going to make its own wafers or cells at a loss (as this would feed through directly to higher overall module costs for the company). But what if module suppliers can buy cheaper wafers and cells on the open market in China? Some of the new entrants that are so desperate to exist or survive in the sector may well sell at a loss just to keep factories running. It would not be the first time that Chinese factories operate at a loss, just to keep the production lines running.
Of all the possible scenarios that could delay the downturn, this is the one I fear may happen. There have been so many new entrants in the midstream space in China of late, and most would never have been profitable in 2024 anyway; so why not sell for any price just to prove that the initial start-up investments and factory build-outs were not in vain?
Next: could manufacturing incentives (like the Inflation Reduction Act) come to the rescue? This is a topic that is clearly on the table today, but only happening in the US; but this is not likely to help Asian based manufacturers either importing to the US or seeking to add low levels of module (or cell) capacity in the US in the near term. It may help some of the pure-domestic (North America) module assembly firms that are able to buy cells from loss-making entities in Southeast Asia; but this is not a sustainable business model.
Ultimately, it could be that the leading module suppliers can work out a way to be profitable through 2024, but the underlying backdrop is still that of a downturn, and one that impacts other module suppliers earlier in 2024 and to a greater extent.
Capex for 2024 may not be formalised until well into next year
If there is going to be a manufacturing downturn in 2024, it could be that capex (for the c-Si segment, and especially ingots, wafers, cells and modules) is the leading indicator of this. Capex can normally be correlated directly to periods of downturn, and the PV industry has seen this before.
The graph in Figure 4 looks at industry-wide capex for PV manufacturing (everything excluding polysilicon) going back to 2005. Upturn and downturn phases for manufacturers tend to follow capex activity, probably with more correlation than any other manufacturing or financial metric, aside from production gross margins.
By going back to 2005, I have managed to track the two major cycles that the PV industry has been through over the past 20 years; in essence, during its entire commercial lifespan until now. I have split out time periods into phases, similar to the first graphic in this article that addressed upturn/downturn from the perspective of polysilicon and module costs and ASPs.
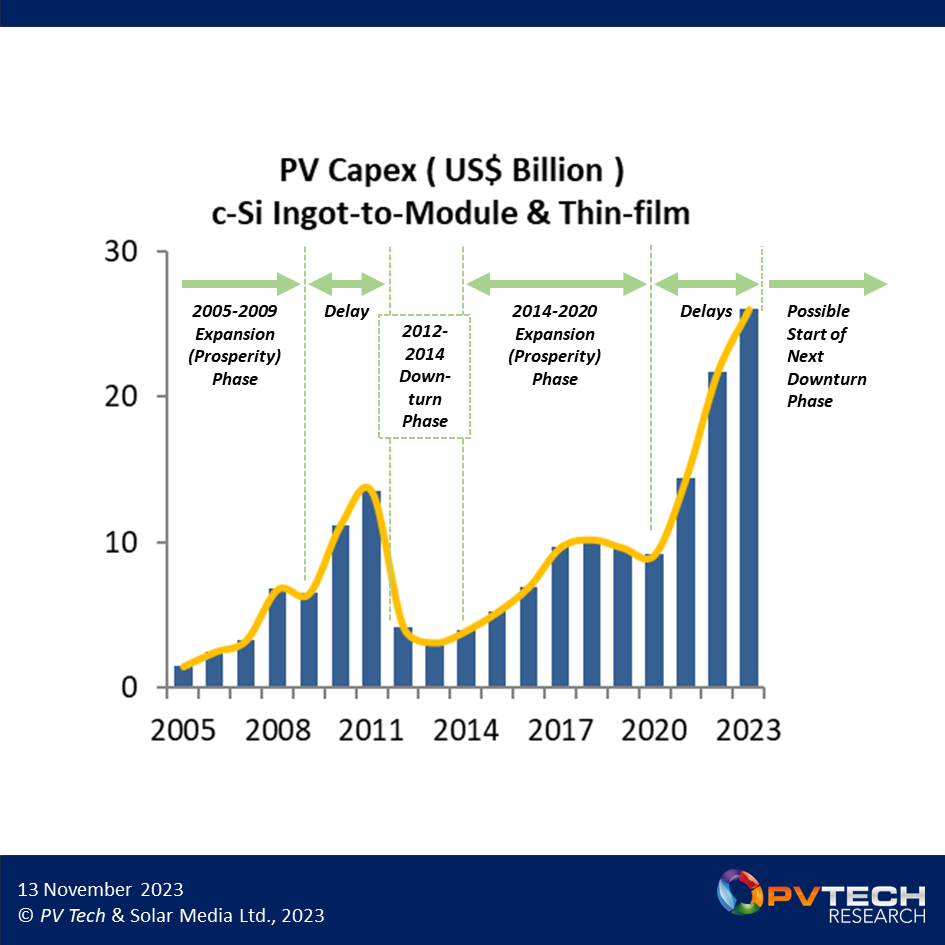
Left to right in Figure 4 above. First, the period until 2009 was largely a growth phase from a sector that had hitherto been a cottage industry, emerging from a research base. Capex had been incurred almost exclusively to boost production levels from a small group of largely Western companies. Polysilicon was borrowed from the semiconductor industry. Over-capacity was not a phenomenon, and while margins were not spectacular for the manufacturing segment, there was a degree of order behind investments and growing market demand.
In 2009, the industry was poised to enter a downturn, or at least see a plateauing effect with regards c-Si capex. The transition from upturn to downturn was in part delayed then by a flurry of capex into thin-film technologies that were once seen as potential options to mainstream silicon-based manufacturing: amorphous-silicon (a-Si) and CIS/CIGS. The artificial peak in capex during 2010-2011 was largely driven by equipment suppliers from the flat panel display segment (Applied Materials, Oerlikon and ULVAC for example) to sell turnkey a-Si based production lines to new start-ups. These efforts failed in their objectives, and the legacy of this will always be the capex spike in the graphic above during this period.
Eventually, the downturn did start, as outlined earlier in this article. Indeed, the subsequent phases of industry evolution (as described in the first graph of this article) are then mirrored by the cycles in capex in the above graph: a downturn during 2012-2013; an upturn from 2014 to 2020; and the delayed onset of a downturn out to 2023.
The capex during 2020-2023 is by all counts out of synch and on a completely unsustainable trajectory. If the only graphic shown in this article was capex, alarm bells would be ringing for 2024 and at what point this is going to hit negative growth territory.
It is very difficult to forecast capex, however. Ultimately, one can only follow the money in real time. And today, with the lion’s share of equipment orders landing on Chinese companies, visibility into book-to-bill metrics is simply not available. During the first industry downturn, the book-to-bill was the ultimate (capex-driven) leading indicator heralding the period of manufacturing difficulties during 2012 to 2014.
Tracking this was possible because of the scrutiny placed on Western public-listed equipment suppliers that were the mainstay of PV manufacturing then, and whose (real) order intake (and backlog) was closely audited. Analysing book-to-bill was possible ten years ago: today, it is impossible.
Who will be the ‘winners’ in a PV manufacturing downturn?
Broadly speaking, PV manufacturers don’t build, operate or own solar assets. Some get involved in the final development and initial build-out phases, but even these companies flip to long-term asset owners pretty quickly or whenever cash is needed. Therefore, we can rule out PV manufacturers having any industry-related activities whereby they have a secondary benefit to module prices (and those through the whole value chain) being depressed.
The winners are those buying modules, of course; at least in the short term. Problems do arise though with module buying (even at bargain prices) because the financial health of the suppliers themselves is even more at risk than normal. What value do you put on a 25-year warranty? Is quality compromised because everyone wants to cut costs? Where is the extra risk if half the components used in the module are from new entrants immediately running at a loss with no prospect of long-term survival? And there are plenty more problems in the mix here. So, yes, low module pricing is great, but a bankrupt manufacturing segment has way more risk than opportunity for anyone in the industry.
Potential winners are also those module suppliers owned by larger entities with deep pockets and that view having a PV manufacturing operations of sufficient strategic value to effectively bankroll (more than in the good times) their PV manufacturing aspirations. Truth be told, the number of companies in this bucket is minimal, and those that come under this category are typically outside the top ten module suppliers by volume that call the shots for everyone in terms of product pricing and market share.
Who else could win in a downturn? Those playing the stock market? But interestingly, many of the companies selling modules today that are part of listed entities are still rated as ‘buy’. Let’s see if this remains in place come March 2024, assuming my article does not spook some ahead of then! (Disclaimer duly noted.)
Technology disruptors. Yes, I actually think the PV industry needs a chronic manufacturing downturn in 2024 to truly allow disruptive technologies to get into the market, or even be fast-tracked with more urgency than is the case today. There is a saying that companies that innovate during a downturn are those that end up in the lead when the market recovers. Of course, this is a vague statement with no detail, but you hopefully get the idea. In most other technology segments where product innovation and time-to-market is imperative, innovating during a downturn is not just an option, it is essential. And even then, with no guarantee the market will want this when it recovers.
But looking at the PV industry, could a downturn in manufacturing (starting in 2024 and running through the whole of 2025) finally be the point to drive technology change in such a way that when strong capex is released again in 2026, it is not simply to build more polysilicon plants in China, more ingot pulling factories in China, and so on.
In this respect, with my innovation-has-to-win-out-in-the-end hat on, perhaps the biggest opportunity arising from a (largely-China-centric) PV manufacturing downturn in 2024 and 2025 will be for the entire Western PV stakeholder community to get serious for once and for all; to back the start-ups, the technology leaders and the manufacturing ecosystem stakeholders, and deliver them a ‘moonshot-clad’ directive to be successful by 2026.
Either way, get ready for a bumpy 2024. And let’s see which companies are first to reset their spending targets and market growth aspirations first.
To subscribe to PV Tech’s Market Research reports, the PV Manufacturing & Technology Quarterly report or the PV Moduletech Bankability Ratings Quarterly report, please contact us here. To understand how the contents of this article are likely to impact PV module buying in Europe in 2024, you may wish to attend our forthcoming PV ModuleTech Europe 2023 conference in Barcelona, Spain on 28-29 November 2023, attendance details for which are here.


")

")
