In the first half of 2026, China rejected enough solar and wind power to supply Mexico for a year. Carrie Xiao looks at what is being done to tackle the country’s escalating curtailment problem.
Under China’s plans to achieve carbon neutrality by 2060, PV and wind power have become indispensable pillars of its new energy mix. As of the end of July 2026, China’s installed PV capacity had reached 1,286GW, surpassing coal power for the first time to become the country’s largest power source by installed capacity.
Try Premium for just $1
- Full premium access for the first month at only $1
- Converts to an annual rate after 30 days unless cancelled
- Cancel anytime during the trial period
Premium Benefits
- Expert industry analysis and interviews
- Digital access to PV Tech Power journal
- Exclusive event discounts
Or get the full Premium subscription right away
Or continue reading this article for free
Despite the rapid expansion of PV installations, curtailment challenges have become prominent in certain regions, bringing renewable curtailment rates back into the spotlight.
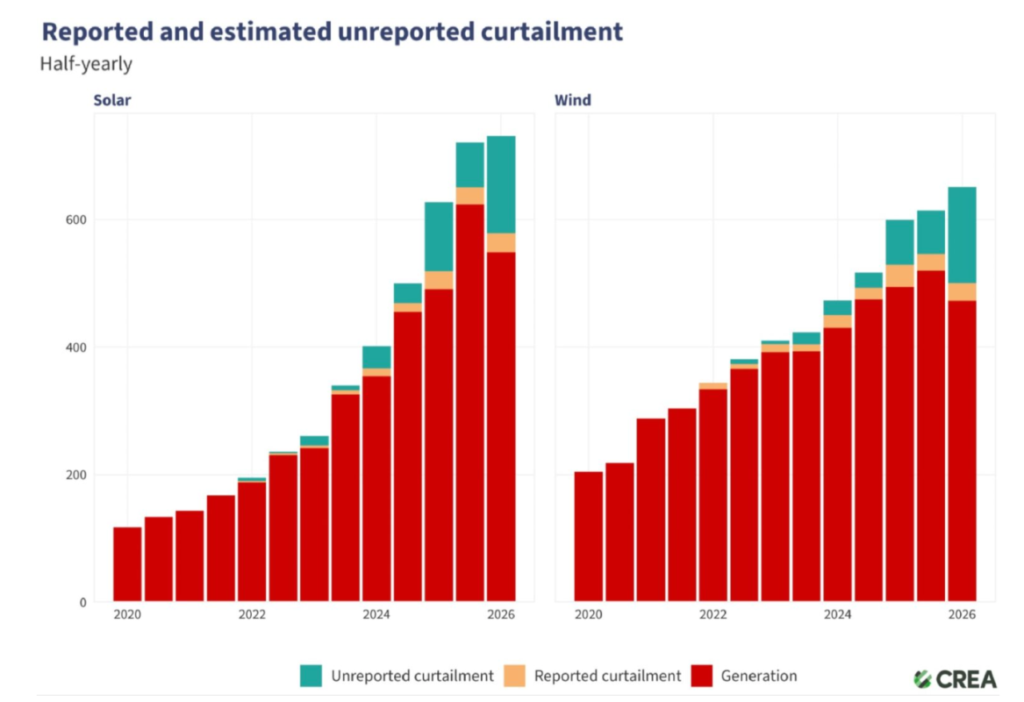
A joint monitoring report by two international non-profit energy organisations—the Centre for Research on Energy and Clean Air (CREA) and Global Energy Monitor (GEM)—shows that in H1 2026, China’s combined wind and PV curtailment—where solar or wind power is pre-emptively rejected due to grid incapacity—reached 360 billion kWh, up 49% year-on-year.
In addition to third-party agencies, recent corporate reports from power utilities also corroborate the wind and PV curtailment problem.
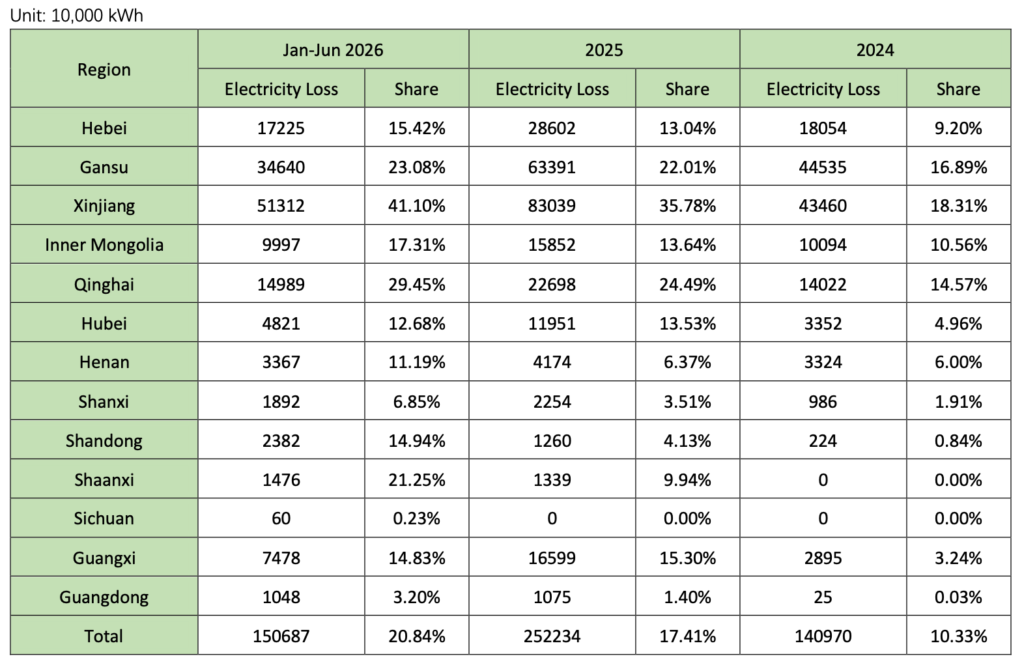
CECEP Wind-Power Corporation, a listed subsidiary of China Energy Conservation and Environmental Protection Group, disclosed in its 2026 semi-annual report that from January to June, the company lost a total of 1,506,870,000kWh to wind curtailment and output restrictions. The group-wide wind curtailment rate stood at 20.84%.
Figure 1 below shows the company’s indirect generation losses due to wind curtailment and output restrictions from 2024 to 30 June 2026.
Meanwhile, H1 2026 filings from other central state-owned power generators show sharp profit declines, epitomised by the paradox of “generating more yet earning less”. Based on disclosed H1 2026 performance figures, China Three Gorges Renewables projected a net profit attributable to shareholders of the parent company of RMB1.045 billion to RMB 1.295 billion (US$155.6 million to US$192 million), down 66-73% year-on-year; Datang Renewable Power’s net profit fell 58-60%; CGN New Energy posted a 49.8% year-on-year decline; GD Power Development reported a 67.3% drop in first-half net profit, with its PV segment’s net profit plunging 62.94%.
Notably, official H1 2026 statistics put the national wind curtailment rate at 9.1% and the PV curtailment rate at 8.6%. Both corporate-reported figures and estimates from overseas research institutions are higher than the official figures.
Experts attribute the sizable gap between CREA/GEM estimates and official statistics to differing calculation methodologies. Official curtailment and utilisation rates are calculated from data reported by grid-connected power plants and serve as the benchmark for policy-making. By contrast, research bodies such as GEM and CREA use weather-based models to estimate potential generation.
Regardless of the methodology, all datasets indicate rising wind and PV curtailment rates. It has become imperative to systematically and comprehensively boost renewable energy consumption.
Specific distribution of wind and PV curtailment
Data released by the National Energy Administration (NEA) show that in H1 2026, the national wind power utilisation rate stood at 90.9%, and the PV utilisation rate at 91.4%, down 2.3 and 2.6 percentage points year-on-year, respectively. These rates have fallen for three consecutive years. Apart from these national averages, several major provinces with large-scale PV capacity recorded utilisation rates below the national average (see Table 1).
According to data from the Power Industry Planning Research and Monitoring and Early Warning Center under the China Electric Power Planning & Engineering Institute (EPPEI), provinces with PV utilisation rates below 91% in Q1 2026 included Shaanxi (89.8%), Gansu (82.5%), Qinghai (76.8%), Ningxia (89.5%), Xinjiang (83.2%), Tibet (63.8%), Hainan (86.5%) and Yunnan (84.8%).
From a regional perspective, provinces with relatively low PV utilisation rates are concentrated mainly in northwest and southwest China—regions that have seen rapid roll‑out of utility‑scale PV projects, including Qinghai, Gansu, Yunnan and Xinjiang. Compared with provinces suffering from insufficient consumption capacity, these regions host a large installed base of PV capacity. This indirectly points to substantial volumes of wind and PV curtailment across these provinces.
According to disclosures from CECEP Wind‑Power Corporation, its wind farms in Qinghai recorded nearly 150 million kWh in curtailed electricity during H1 this year. The curtailment rate reached 29.45%.
| Region | Wind utilisation rate | PV utilisation rate |
| Tibet | 67.10% | 63.80% |
| Qinghai | 92.00% | 76.80% |
| Gansu | 90.80% | 82.50% |
| Xinjiang | 88.00% | 83.20% |
| Yunnan | 91.50% | 84.80% |
| Hainan | 86.50% | 86.50% |
| West Inner Mongolia | 85.00% | 90.80% |
| Shaanxi | 94.50% | 89.80% |
| Ningxia | 90.50% | 89.50% |
| Hebei | 87.70% | 90.00% |
Qinghai’s disproportionately large new‑energy installed base has driven high curtailment rates and low power prices. Figures released by the NEA show that as of end‑June 2026, Qinghai’s cumulative new energy installation stood at 63.1702GW, accounting for 74.06% of the province’s total power‑generation capacity. Within this total, wind power installation has surpassed 16GW.
In addition, Lambda spot‑market data indicates that since January 2025, actual grid‑dispatched PV output in major new‑energy provinces participating in the spot market has generally been lower than forecast, marked by notable PV curtailment and output constraints. The data shows that the ratio of actual to forecast PV generation generally hovers around 70% and has never exceeded 80%. In certain provinces such as Shandong, this ratio can drop to nearly 66% in low‑output months—equivalent to a curtailment rate of close to 40%.
Grid bottlenecks
Why is the PV consumption dilemma growing more severe? The first and unavoidable reason is that capacity additions have outpaced grid build-out.
As is widely recognised, intermittency and volatility are inherent characteristics of PV generation, which are not problematic in themselves. The real bottleneck lies in grid construction failing to keep pace with the rapid expansion of PV installations.
The joint report by CREA and GEM explicitly identifies inadequate grid development—unable to keep pace with green energy capacity growth—as the leading cause of large-scale renewable curtailment in China.
The northwest region serves as the country’s core hub for new energy development under the “sand, gobi and desert” initiative, an effort to build new renewable energy capacity in regions with significant solar and wind potential and abundant land, such as Xinjiang and Inner Mongolia. While large-scale base projects under the initiative continue to advance, the region is constrained by the delayed construction of outbound transmission corridors and insufficient local power demand. Consequently, surplus renewable power cannot be fully consumed or exported in a timely manner.
Experts from State Grid Corporation of China highlight two dimensions of curtailment patterns. Spatially, curtailment remains concentrated in the ThreeNorth Region, which includes northern, northwestern and northeastern China. By 2030, curtailed power within this region is projected to account for roughly 80% of total curtailment across State Grid’s service territory. Temporally, spring and autumn curtailment accounts for 74% of annual curtailment, while mid-day curtailment represents 74% of daily curtailment.
Sharp supply-demand mismatches in system flexibility and regulation capacity, coupled with strains on multi-level grid configuration capability, constitute the core bottlenecks holding back renewable consumption today. Retrofit potential for flexible operation upgrades on conventional thermal power units is shrinking. Pumped-storage projects feature long construction lead times, while new energy storage capacity still suffers from weak economics at the current stage. Wide-range optimal resource allocation via large-scale grids also faces hurdles such as scarce transmission corridor resources and steeply rising construction complexity.
Beyond grid-infrastructure constraints, electricity prices represent another critical challenge weighing on renewable energy consumption.
Following the implementation of Document No. 136, which promotes full market participation of renewable energy, PV projects have lost fixed feed-in tariff (FIT) protection. With spot market prices remaining relatively low—compounded by consumption constraints in certain regions—project returns are under sustained pressure.
According to May electricity market data released by State Grid Shandong Electric Power Company, the reference settlement price under the PV pricing mechanism stood at a mere RMB51.042/ MWh. This translates to approximately RMB0.051/kWh—less than RMB0.1.
Statistics from the NEA show that nationwide newly installed decentralised PV capacity tumbled 60% year-on-year in H1 2026, with Shandong alone recording an 84% drop. Installed capacity for C&I decentralised PV fell by over 61% year-on-year. For certain decentralised PV projects, January on-grid tariffs ranged from RMB0.013/kWh to RMB0.3232/kWh, representing a drop of up to 97% compared with the local coalfired benchmark on-grid tariff.
Depressed electricity prices, compounded by steep declines in grid-connected electricity volumes due to curtailment, have systematically undermined the revenue models of existing power plants. Some generators saw their PV on-grid volumes plunge by as much as 36.74% in Q1. This partly explains the widespread profit downturn across power generation firms. Caught between electricity that cannot be dispatched and power that cannot fetch viable prices, China’s PV plants are trapped in a predicament.
Solving the consumption dilemma: a systemic roadmap
To address renewable energy consumption challenges during China’s 15th Five-Year Plan period (2026-2030), the 15th Five-Year Plan for the Development of the New Power System, jointly issued in June by the National Development and Reform Commission (NDRC) and the NEA, lays out a systematic roadmap. Centred on coordinated management across power generation, grids, loads and energy storage, the plan marks a strategic shift away from the single-minded pursuit of scaling installed capacity toward system coordination and efficient renewable energy consumption.
First, regarding energy storage, the goal is to transform its role from “playing catchup” to serving as a stabilising anchor for the power system. The plan sets a target for total new energy storage capacity to reach 300GW by 2030, including roughly 160GW of new capacity added during the 15th Five-Year Plan period.
Key measures include: rational energy storage deployment at large-scale projects in desert areas; adding approximately 80GW of standalone storage resources for peak-shaving and supply guarantee, targeting a 4-hour discharge duration; advancing retrofits for existing storage assets; and exploring applications for grid-forming technologies. Meanwhile, pumped-storage installed capacity is targeted at 160GW.
Second, regarding the coordination of power generation, grid, load and storage, the approach must shift from “working in isolation” to “coordinated operation”. The old model—in which each link was planned in isolation— must be replaced by end-to-end coordination across power generation, grid, load and storage. The demand side should no longer function merely as a passive power consumer but as a flexible resource participating in system regulation. Specific targets include: over 100GW of demand side peak-shaving capacity; more than 50GW of maximum adjustable capacity from virtual power plants; and leveraging electric vehicles as mobile storage to deliver 50GW of adjustable capacity via vehicle-to-grid (V2G) integration.
Third, regarding market signals, the approach is to leverage them to optimise resource allocation. The overarching goal is to substantially establish a nationwide unified electricity market system. Regional differentiated utilisation-rate targets will guide investment. Authorities will fully roll out the power spot market and refine ancillary service markets, while putting in place a robust capacity-compensation mechanism to incentivise thermal-power units to provide peak-shaving support for renewable energy generation.
Fourth, regarding power-grid upgrades, the focus is on strengthening both the “arteries”(backbone transmission) and “capillaries” (distribution networks). This means boosting long-distance transmission capacity—targeting west-east electricity transmission capacity above 420GW—alongside upgrading distribution networks to accommodate decentralised energy interconnection. For instance, State Grid is prioritising ultra-high-voltage (UHV) corridors to deliver wind and PV output generated from desert and barren land resources to major load centres across eastern and southern China via high-efficiency long-distance transmission. In addition, Gansu Province already operates multiple UHV transmission lines that deliver Gansu-generated power to Shandong, Sichuan and Zhejiang, accelerating progress for west-east electricity transmission initiatives.
Fifth, regarding model innovation, the focus is on local consumption and “computing-power coordination”. New business model—including direct green-power interconnection, smart microgrids and zero-carbon parks—will be vigorously promoted. In parallel, artificial intelligence will be deployed to improve renewable energy generation forecasting and grid-dispatch performance, guiding energy-intensive data centres to increase their uptake of green electricity.