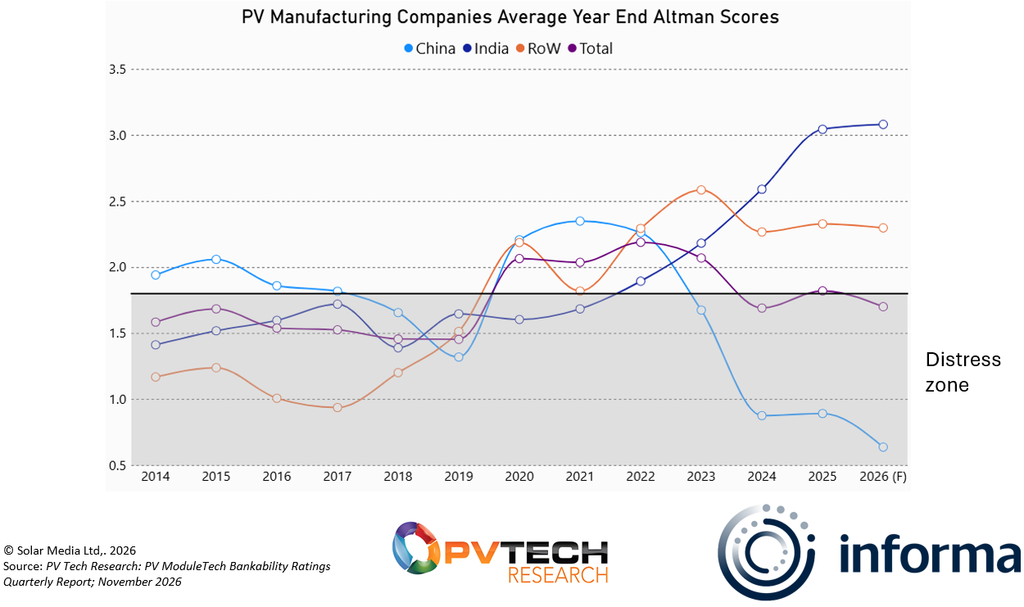
Welcome to the PV Chart of the Week, produced in tandem with our colleagues at PV Tech Research. This week, we look at the financial Altman scores of solar PV manufacturers worldwide.
They reveal a very stark difference between Chinese and Indian solar manufacturers, with the former still in the distress zone. Since PV supply chain prices of Chinese products declined in 2023 – with polysilicon prices collapsing from RMB235/kg (US$35/kg) in February to RMB64/kg in July 2023 – Chinese manufacturers have continued to lose money and are not expected to recover this year.
Try Premium for just $1
- Full premium access for the first month at only $1
- Converts to an annual rate after 30 days unless cancelled
- Cancel anytime during the trial period
Premium Benefits
- Expert industry analysis and interviews
- Digital access to PV Tech Power journal
- Exclusive event discounts
Or get the full Premium subscription right away
Or continue reading this article for free
In the first nine months of 2026, the top Chinese manufacturers – Jinko, JA, LONGi, Trina – have all reported year-on-year revenue declines. As the chart above highlights, the average year-end Altman score for Chinese manufacturers is forecast to further decrease in 2026.
“A lot of it is due to stock prices (and therefore valuations) decreasing across the board in China. This isn’t solely a PV issue, but the losses over the last few years haven’t helped them either with respect to stock prices,” explained Joe Hennessy, analyst at PV Tech Research.
In India, on the other hand, the finances of PV manufacturers have continued to strengthen on the back of booming demand for domestically produced modules since the implementation of the Approved List of Models and Manufacturers (ALMM) in 2024.
“This also led to manufacturers being able to demand higher prices. Therefore, profit margins and revenues have been scaling over the last few years, with huge increases in capacity. A lot of them were also able to access the high prices in the US up until recently, which also helped with margins,” added Hennessy.
Finally, for companies outside these two markets (i.e. RoW in the chart), the higher average Altman score is primarily driven by companies focused on supplying the US market.
What is the Altman Z-Score? It is a collection of weighted financial ratios, developed in the late 1960s by Edward Altman. It measures the liquidity, leverage, profitability, valuation and sales of a company, used to determine the probability of it going bankrupt in the next two years.
The original score is classified into three regions, the safe zone above 3, the grey zone, between 1.81 and 2.99 and the distress zone below 1.8. We always try to apply context, as the modern manufacturing landscape globally is quite different to the one the score is based on, but this shows how much the current market conditions have affected these companies.