
During the recent series of articles on PV-Tech – outlining the drivers, methodology and validation of the new PV ModuleTech Bankability ratings for PV module suppliers – one of the key inputs required to generate the overall supplier bankability score (and rating class) was the financial strength of each company.
Indeed, to create a useable metric (bankability score, between zero and ten), it is necessary to know both the financial and manufacturing strengths of PV module suppliers. Therefore, it invariably raises questions as to how companies that are publically-traded and privately-held can be benchmarked.
Try Premium for just $1
- Full premium access for the first month at only $1
- Converts to an annual rate after 30 days unless cancelled
- Cancel anytime during the trial period
Premium Benefits
- Expert industry analysis and interviews
- Digital access to PV Tech Power journal
- Exclusive event discounts
Or get the full Premium subscription right away
Or continue reading this article for free
This issue is of course part of a wider debate on how to benchmark all PV module suppliers from a financial standpoint, regardless of whether they are listed or not.
The topic is highly contentious within the PV industry: most of the PV module suppliers today are headquartered in China. In this country alone, PV module suppliers can be listed on Asian stock exchanges, be part of listed entities within which the solar operations (module supply or other sector related) is a minor business unit, or fall under the category of state-owned/controlled. A few of course are listed on New York stock exchanges, but this is becoming a less-desired option now compared to a few years ago.
However, the main questions I got, following the announcement of the four AA-Rated suppliers recently, went along the lines of: The four AA-Rated suppliers are all listed – did you not consider private companies? Others simply asked how private companies were dealt with within the analysis, partly out of curiosity, but also recognising that this is something no-one has addressed with any discipline or vigour until now.
This article describes how public-traded and privately-held PV module suppliers are benchmarked, as part of the overall PV ModuleTech Bankability analysis. In so doing, I will explain the methodology behind the approach, and show how the results were validated and tested. In particular, I will discuss error bounds associated with the new approach.
Let’s start with the obvious question though: Why bother at all?
Why explaining the methodology is key
The subject of benchmarking public and private companies is not new; anywhere, or at any time. Within the PV industry, due-diligence experts within certain financial circles will no doubt have their bespoke means of doing this. Credit ratings suppliers are also readily available to subscribe to (such as Dun & Bradstreet for example), but often they are relied upon only on a case-by-case basis as a means of minimizing risk associated with any payment terms or contract negotiations.
It is probably fair to say that, until now, no-one has proposed (or likely developed) any robust method to benchmark PV module suppliers, whether public or private. It is likely those that needed some kind of audit trail on private entities have relied upon accessing company accounts as required, ideally third-party verified.
Configuring a means of benchmarking any PV module supplier – at any time and with competitors that are public-traded or privately-held – is a whole new proposition; no doubt, many would suggest ideas but fall short by not disseminating any form of validation or gathering good source data in the first place.
Within the rest of this article, I will explain systematically how this challenge is addressed within the PV ModuleTech Bankability Ratings; why the issue turns out not to be as important as many fear; and finally, why having a practical means of getting up-to-date numbers from privately-held companies rather dominates the problem in the first instance.
Before diving into the details, I will now explain why the whole issue is not quite as critical today, especially when considering large-scale solar module supplier selection.
Framing the importance of privately-held PV module suppliers
In looking at the 14 PV module suppliers that have ‘A’ or ‘B’ ratings (i.e. fall outside the Speculative ‘C’ zone), only two of these companies are privately held today (Trina Solar and JA Solar). The rest are public, or part of parent companies that are listed (and by default act as module supplier unit guarantor).
Recall that the full list of 14 companies will be revealed during the forthcoming PV ModuleTech 2019 event in Penang, Malaysia on 22-23 October 2019.
In fact, even the two companies (out of the top-14) that are the exception (Trina Solar and JA Solar) have a fully-audited multi-year track record of financial operations until the past 2-3 years when each company delisted: Trina until the end of 2016, JA Solar until the end of 2017.
During the intervening time period, it would be fair to say that neither company has made any radical changes to its business operations or dominant source of revenues; nor have they diversified operations through any acquisitions or mergers. In short: how these companies operate today is likely to be very similar to the period before they delisted.
Therefore, even if there was no appetite to do any privately-held benchmarking, it would almost suffice to merely pro-rate the performance of Trina Solar and JA Solar for the current (intermediate) time-period (between delisting, up to the expected relisting in China/Asia in the near future), starting with all the historic filings that reside at the SEC.
The good news is that, in the case of these two companies, the pro-rated approach comes out within +/-5% of the method outlined below in the case of privately-held PV module supplier companies. I will likely explain this in a dedicated PV-Tech article in the coming weeks.
Putting privately-held suppliers into perspective
The vast majority of the privately-held PV module suppliers today simply don’t have the manufacturing strength to be ‘A’ or ‘B’ class rated, regardless of their finances. This was one of the fundamental drivers behind the PV ModuleTech Bankability Ratings: to be a top-performer, both manufacturing and financial strength have to be in place going back 12-24 months.
This was critical to differentiate between the companies that can supply to 300-400 MW utility sites, and those that barely produce this quantity over 12 months, or choose to sell in kW-volumes to residential rooftop markets globally without ever adding any new capacity, diversifying globally, or investing in R&D, for example.
Therefore, if the goal is simply to have a short-list of 10-20 PV module suppliers that are in the running for 100-MW-plus utility-scale projects today, it is possible to draw a line through about 95% of the PV module supplier universe, based entirely on manufacturing score (risk of supply).
However, there are still many strong reasons to develop a method to account for any privately-held company: there is no guarantee that the 14 companies currently A/B graded will remain listed in the future; to account for the 5-10 that fall into the border of the B/C grades; and to allow objective analysis and peer-based ranking of the 50-100 module suppliers that are often heard claiming to be on somebody’s ‘tier-1’ module supplier list. (This appears to be one of the most requested issues based on industry feedback to the new PV ModuleTech Bankability Ratings.)
Retaining the Altman Z starting point
I outlined in (previous articles on PV-Tech) why the Altman Z method (Altman, E.I., Journal of Finance, Vol. XXIII, No. 4, pp 589-609, 1968) was adopted as the starting point in the financial score analysis within the PV ModuleTech Bankability Ratings. Here is a quick summary again.
Most third-party industry firms – and plenty that have a form of bias that precludes them from being classed as independent – that have sought to benchmark PV module suppliers until now have used the Altman Z scores, confined to the 1968 ratios/coefficients/zones that were proposed by Altman over fifty years ago to assess the likelihood of bankruptcy for manufacturing companies with turnover above a certain threshold.
No assumption was made whether this is the best approach for PV module suppliers now, or in the past. The method was used simply because it has been, by far, the most frequently cited and adopted approach used across a wide range of sectors. Everyone identifies with it; the methodology is crystal-clear; and anyone can yield known data/scores from company filings, with limited accounting knowledge. The use of it avoids doubt, uncertainty and questioning; it offers a starting point that is credible and workable.
The way in which we took the Altman Z scores for public-listed PV module suppliers (or parent entities) and converted the scores (based on number of standard deviations from a mean value) to a PV-specific 0-10 scoring system, was covered recently in the article on (PV-Tech here). This is probably the first time this type of analysis has been proposed within the sector.
PV-Tech research ranks PV module suppliers by financial health
The mapping to the new 0-10 band – and making it more aligned to PV industry operating zone terminology – was done entirely to have a means to then combine the financial scores with the manufacturing scores (also ranked 0-10) in the overall bankability calculation. It completed the quantitative nature of the studies, and allowed direct benchmarking to be done across a host of different areas.
The key thing to note though is as follows: the PV financial output in the PV ModuleTech Bankability studies is simply using the Altman Z calculations, then mapped to a 0-10 PV scoring band. Bankrupt companies score zero; chronic performing companies typically score below one. Any score above five (or 50%) is in what I refer to as the ‘Comfort Zone’ of PV module supplier operations, as seen looking at sector-specific data going back 5-10 years.
Therefore, when the challenge of benchmarking privately-held PV module suppliers was addressed, an obvious route was to align with the Altman approach, but look at a practical and approximate variant, using readily-obtainable financial data from private companies.
Reality-check on privately-held companies
Before I proceed to explaining the new approach and its validation, it is perhaps prudent to get some reality on what type of information one can expect to get from any privately-held organization – PV or otherwise – as this ultimately guides what any model can be based upon.
Simply put, if you can’t access full company accounts for any private company at any time, don’t set up a model that uses this as an essential pre-requisite. Don’t base any model also on a reporting requirement that is country-specific, even if there is a platform that one can go to in order to get (often well-outdated) company accounts. Don’t think for a second that private companies’ reporting is remotely in line with listed companies, or is even available covering the past 12-18 months (at best). And don’t use company-specific terminology (such as from a Dun & Bradstreet report for example) that is source-specific and not amenable to widespread benchmarking.
Therefore, the final approach adopted was guided by two key themes discussed above: first, equate with the public-listed specific Altman ratio-discriminant model; second, choose inputs that can be realistically obtained from companies (without relying upon a full audited set of accounts every three months dropping into your inbox!).
The new methodology adopted
It should be mentioned that there is an Altman equivalent for privately-held companies (see for example, Altman, E.I. (2000) in Handbook of Research Methods and Applications in Empirical Finance, Vol. 5). It retains the concept of summing terms based on liquidity, leverage, profitability, solvency and activity, but substitutes the working capital and market capitalization entries with alternate numbers/terms. It requires eight accounting terms to be known (compared to the public listed version that is based on seven terms).
It also creates different scoring values and zones, which makes any benchmarking even more challenging. In fact, the best that can be done is to use each model in isolation; not collectively.
To address the challenge of preserving the Altman ratio-based starting point, I opted to look at a modification of the public-listed Altman equation that reduced the terms and ratios to a minimum, while keeping the error bounds on the final financial score within certain acceptable bounds.
In essence, what is the minimum number of terms/ratios that allows getting scores to within +/- 10% of what they would be had all the terms/ratios been applied. For example, this allows us to decouple the market-cap issue, and not try to find any equivalent value for private companies (such as the book value of equity).
This was done by looking at all the Altman Z scores accumulated in-house for listed PV module suppliers (or parent entities), and identifying the significance of the terms (while also factoring in the type of data that that could be expected from private companies in practice, so they were not seen to be divulging too much confidential information to the outside world).
Importance of identifying different company profile groupings
In looking at all the PV module suppliers (and parent entities) that are publically-listed, there is of course a wide range of different business models in place. For example, you would never seek to find any commonality with SunPower and Yingli Green, or First Solar and BYD.
Therefore, to establish any short-cut to reaching financial strength scores, it is first necessary to form test groups where selected companies have similar characteristics and can be correctly benchmarked or pro-rated.
As a prelude here, it should be pointed out that the fundamental driver is to benchmark PV module suppliers mainly in China that are not public-listed, such as JA Solar and Trina Solar; but also to account for a grouping of 5-10 other suppliers that may be perceived as competition for non-residential (in particular large-scale) business today outside China. Understanding this is key, as it helps increase the relevance and accuracy of the approach undertaken, and also avoids wasting time on PV module suppliers that are not in the mix for investor-driven projects.
It should be pointed out also that the requirement to broaden the scope for Japanese, South Korean or Taiwanese module suppliers is less important because virtually all PV module suppliers across these regions are part of larger public-listed organizations. The question of India is also an anomaly of sorts, with the financial health of Indian companies in general being somewhat unique; coupled with the fact that few Indian PV module suppliers have any appreciable market-share today outside India in terms of large-scale utility-based site deployment.
Returning then to the China challenge, the list of traceable public-listed PV module suppliers (or parent entities) was divided up into three different focus groups based on company profile (how much PV module supply dominates proceedings) and known operational performance (more on this topic below).
PV module supplier categories
In terms of splitting out the public-listed PV module suppliers, the first category was based upon current (or former) US-listed PV-sector revenue-dominant suppliers, and included JinkoSolar, Canadian Solar, JA Solar and Trina Solar.
The next group included Chinese-listed entities of which PV operations were a part (business unit or otherwise), such as Talesun, Risen, Astronergy and Jinergy.
The final grouping was specific to Chinese PV module suppliers whose operations today were heavily constrained by ailing financial performance (including for example, Yingli Green).
Other companies were assessed but largely fell into one of the three categories above, or were clear outliers (extreme cases) and should not be used in any benchmarking exercise.
Keeping the goal at +/-10% equivalence to the scoring generated from the initial 5-ratio Altman Z approach, the number of ratios was able to be reduced from five to three for each grouping. (Note, the final three ratios chosen are the same for each grouping selected, not varied.)
Once this was done, the final coefficients for the three chosen ratios (noting that a scaling constant is essential now) were determined using a routine least-squares linear regression analysis, where the ‘residual’ is the difference between the original full 5-ratio Altman derived F score and the new reduced 3-ratio approach.
Therefore, unique weighting coefficients (and constants) are derived for the three different groupings, which should not come as any surprise, given the different operating models at play across the selected company groups chosen. Essentially, different ratios dominate when public-listed companies are performing well, compared to when they are in trouble.
With the three fixed numbers determined (two ratio coefficients and an additive constant) for each of the three ‘test’ groups, the only question was to determine the level of accuracy for the reduced-fit model when applied to the known dataset (public-listed PV module suppliers/parent-companies).
I will explain this more clearly below now, in reference to the figure shown also.
Validation of the model
Being able to show the validation in a simple graphical format was considered fundamental, as this allows anyone to see how accurate the approach is and make their mind up as to the approach used in the ratings system.
To convey this, I have plotted (on the x-axis) the original (full-analysis) Altman Z scores going back 3-4 years for each company, converted to the 0-10 (F) scoring band as explained previously; and on the y-axis, the equivalent 0-10 financial (F) score, using the new shortened variant (three ratios, with the best-fit coefficients/constant) that is to be used to normalize scores from privately-held companies.
The match with the shortened variant to the original Z score value is then a test of the approach validity. This is shown in the graphic below, where the 1:1 line-fit reference would represent 100% accuracy. How much the points deviate then from the 1:1 line-fit is a useful visual measure here of the approach accuracy/validity (without having to rely on statistical terminology for now).
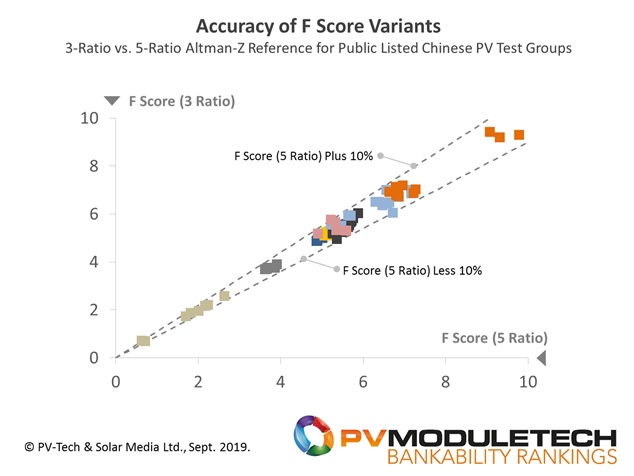
Shown also in the scatter-plot are two dashed straight lines above and below the 1:1 fit. These show the upper/lower bounds at the +/-10% accuracy levels for any given value.
The conclusion here for now is that it is possible to use a reduced model (down to four values, excluding market-cap, and three ratios), that allows accuracy of the final financial score (0-10) within +/-10% accuracy; as long as companies are properly assigned to comparative groupings.
Red flags are rarely wrong
Indeed, the key is knowing which public-listed PV module supplier grouping to benchmark against, for any privately-held company that is likely to be competing globally for large-scale site deployment.
To do this, one does need good a-priori knowledge of the companies in question. This is probably a barrier to many third-party organizations that may have strong accounting or credit-benchmarking skills, but are not connected or knowledgeable enough of the sector.
It also comes over in many of the legacy Altman Z comparisons done in the sector that these can lack a good dose of reality-checking, and can be comprised of entities no longer actually making solar modules!
Anyone embedded in day-to-day PV dealings will know intimately that there are many ‘signs’ that are indicative of how a PV module supplier is performing from an operational standpoint, without needing to be privy to any financial data!
In this regard, market-related activities tend to be most pronounced when PV module suppliers are going through difficulties, and are often accompanied by issues such as: lack of capacity expansions; reductions in headcount; litigation in respect of contract deliverables; cash-constrained enforcement limiting any technology upgrades to existing capacity; or unexpected and abrupt C-level resignations or forced removal from office.
However, in such extreme cases, it is somewhat futile to seek to benchmark these companies. The risk in engaging with this subgroup is considerable and should be clear to anyone looking at the sector. Or at lead, it should be…
Sadly, the PV industry appears to be highly adept in overlooking often blindingly obvious red-flags that hover around a number of PV module suppliers (many of whom have been included in ‘tier-1’ type listings in the past few years).
Aside from rather questionable due-diligence (assuming this even took place), the reason that distressed and technically-bankrupt PV module suppliers still seem to sell product for large-scale utility projects must surely come down to one simple fact: price (ASP).
Related to this is product availability (limited pipeline owing to sales inefficiency), and perhaps payment terms that end up being hugely in favour of the buyer who ends up concluding that they have nothing to lose.
But in these cases, it is likely someone will indeed lose out over the next 25 years of desired site yield and targeted performance ratios, even if the original buyer of the modules has long since cashed in on their up-front investment and exposure to risk.
Applying to the private PV module supplier universe
In summary, just four data-points (two from the balance sheet, two from the income statement) allows for fairly good benchmarking of private companies. In fact, it gets somewhat easier if the company is mostly a pure-play module supplier (revenues dominated by PV module sales). In this case, revenues themselves are of course easy to estimate (normally to within +/-10%) based on annual module shipments and blended ASP sector trends.
Ultimately however, the driver is not to rank the 100-plus companies with sub-100-MW annual module shipment volumes (normally confined to their local markets and rooftops), alongside any 5-10 GW global utility-scale module supplier. This comparison benefits no-one at all, is highly misleading, and incorrectly normalizes companies based purely on them being able to produce/source/ship a PV module.
Going forward, I will be looking at validating further the new approach when required, and also doing any changes that increase its accuracy (or indeed flagging any one-off outliers that are simply extreme values and have no means of aligning, such as chronic-performing near-bankrupt companies).
Forthcoming PV ModuleTech Bankability findings
During the next couple of months, expect to read more on PV-Tech about the new PV ModuleTech Bankability Ratings. The goal for now is simply to explain clearly how to rate, rank and assign classification to PV module suppliers, and to provide validation and discussion at every stage of the process.
I will soon be addressing one of the other frequent questions received in the past few weeks: How many so-called ‘tier-1’ companies are unbankable? This question is of course not as black-and-white as many suspect. I will explain more on this topic shortly on PV-Tech, but very quickly for now…
Over the past ten-years-plus, there have been various ‘tier-1’ type listings generated by different organizations, some of the first being muted on PV-Tech back in 2010. Some are widely circulated on social media platforms; others are held in-house and rarely seen.
More than 50 companies today can be heard claiming to be ‘tier-1’, and within this list, there is a wide range of company strengths and weaknesses.
For example, can one really consider companies like Risen Energy and Winaico (both on ‘tier-1-type’ lists) to be remotely comparable? Therefore, one can understand why there is so much confusion about this somewhat redundant terminology; more on this shortly with supporting analysis and why indeed it may be time for the industry as a whole to finally consign this classification to the history books.
The next major company-name disclosure from the PV ModuleTech Bankability Ratings will occur during my presentation at the forthcoming PV ModuleTech 2019 meeting in Penang, Malaysia on 22-23 October 2019. Details on how to attend this event can be found here.


")
