
This article continues our series of features introducing new methodology that allows leading PV module producers to be categorised, ranked and short-listed by manufacturing and financial strength metrics; ultimately providing an investor-risk (or bankability) profile of PV module suppliers for non-residential end-market selection.
This is the third of six articles on PV-Tech.org that will provide full transparency on the methodology used to assign investment risk to PV module suppliers selling to commercial, industrial and utility segments of the industry. The full dataset captures research findings by PV-Tech going back more than 10 years.
Try Premium for just $1
- Full premium access for the first month at only $1
- Converts to an annual rate after 30 days unless cancelled
- Cancel anytime during the trial period
Premium Benefits
- Expert industry analysis and interviews
- Digital access to PV Tech Power journal
- Exclusive event discounts
Or get the full Premium subscription right away
Or continue reading this article for free
The first article, PV-Tech research set to reveal investment grades for global PV module suppliers, introduced the research methodology, focusing on the supply strength ranking of PV module suppliers. The second feature, PV-Tech research reveals how to assess PV module suppliers’ capacity claims, explained how these companies can be ranked based on their capacity strength.
The third part of the series here outlines PV technology leadership among the top 100 global module suppliers, forming the final part of the inputs that allow manufacturing strength to be fully understood for each company.
The output from the overall analysis – accumulated by the PV-Tech research team over the past five years in particular – will form a key part of my opening talk at the forthcoming PV ModuleTech 2019 conference in Penang, Malaysia on 22-23 October 2019.
The first article introduced the basic relationship between module supplier bankability (B), manufacturing (M) and financial (F) scores as:
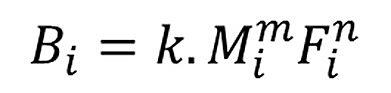
where k is a scaling factor that maps bankability scores to a 0-10 band, m and n are power coefficients derived from regression analysis, and i is a variable that is module-supplier and time-period specific. The manufacturing health score/ranking is expressed as:
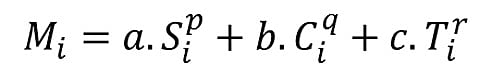
where a, b, and c are factor-dependent weightings, scaled to generate manufacturing health scores for each company by quarter (i) in a 0-10 band; S, C and T are the module supplier shipment, capacity and technology ratios introduced above; p, q and r represent power factors derived from regression analysis.
This article focuses on the technology score (T) and how this is derived.
Manufacturing technology (T) strength score methodology
The manufacturing technology factor (T) ranks PV module suppliers, by looking at investments into capital expenditure (capex) and research and development (R&D).
Extensive efforts are taken by PV module suppliers to create a perception with customers of technical differentiation and leadership; often this has the appearance of brand positioning, rather than supported by any major performance benefits, or matched by investments into capex (in particular for line upgrades) and R&D.
However, today in the CIU segment – with the exception of First Solar (by virtue of being technology-differentiated) – the non-residential segments of global demand are dominated by p-type c-Si modules, with most companies having near-identical module specifications across their datasheet sets. Performance differentiation tends to come out mainly during reliability and pre-shipment testing stages.
As such, it is inappropriate (and largely misleading) to rank module suppliers based purely on product specifications. This conclusion is further justified by looking at cell and module developments over the past decade, and the ability of new entrants into PV manufacturing to replicate production lines and process flows of the current state-of-the-art p-type manufacturers, and claim technology-equivalence very quickly.
The solar PV industry is certainly not like adjacent technology segments such as semiconductor and flat-panel displays, where a small group of companies control technology roadmaps and market-share, in part arising from major capital expenditure and R&D spending that prohibits the marketplace from becoming crowded.
However, despite these observations, there is a direct relationship between technology investment levels (capex and R&D spending) and sustained module supply leadership to non-residential PV segments.
Indeed, major shifts in allocations to capex and R&D (either through increased investments or dramatic cuts) still tend to be a leading indicator of changes 12-18 months out across both shipment volumes and operational performance.
The market-leaders also tend to have meaningful investments (across both capex and R&D) over extended time periods, and especially during industry downturn cycles that are normally pre-empted by sharp declines in total capex across the sector.
However, there remains a sizeable group of companies (almost exclusive to China) that operates with practically no R&D investments of note, and that appears to be able to add new capacity volumes at capex levels a fraction of those typical of the sector as a whole. In this respect, simply rationalizing capex investments across the top 100 PV module suppliers can be further complicated when distressed capacity from insolvent entities gets transferred to new or existing manufacturers on a zero-cash basis.
In order to derive technology strength (T) scores (across capex and R&D terms), each of these terms needs to be isolated for all the module suppliers by quarter. This turns out to be highly time-intensive and challenging, and has taken the PV-Tech research team almost five years to establish a robust methodology here.
Very few companies issue PV-specific capex and R&D numbers any more. Those that do tend to have many different contributions to capex (PV and other segment spending allocations, PV project site acquisition and related downstream spending line-items) or lump R&D into whole-company reporting data. Furthermore, no company today segments capex by ingot/wafer/cell/module, unless of course they are pure-play at a single part of the value-chain.
For the capex part of the analysis, we focus only on the cell and module stages of the value-chain, and remove polysilicon, ingot and wafer capex for any companies that have backward-integrated capacities in-house. The rationale for limiting capex to only cell and module stages is similar to that outlined in the previous blog where we outlined the factors driving PV module supplier capacity (C) values. We went through various iterations of capex segmentation, checking at each time the results of the analysis against the perceived market brand/positioning/bankability (the qualitative dependent variable).
The clear outcome from this was not to confine capex for PV module suppliers at the module assembly stage only, but to include company spending on both cell and module stages. This turns out to be extremely powerful in the context of the study, because of the trend of cell-dominant players (mainly Chinese companies) using this as a stepping-stone to having global module supply aspirations.
This has happened frequently over the past 20 years, going back to the move by JA Solar from pure-play cell maker to global module brand supplier status. Other similar tactics have been deployed with success by LONGi Solar (prioritising the move from wafer-leader to cell production and module supply driven), and GCL (through GCL-Poly and GCL-SI affiliate operations).
The fact that multi-GW cell producers in China have been following internal mandates to play on the global (overseas) stage at the module supply level should not come as too much of a surprise.
Indeed, today, the climate with China as a whole is only supportive of companies seeking to sell the China technology-leadership brand outside the country, and the solar sector is prime for this type of behaviour.
Therefore, module suppliers that have recently expanded upstream (cell to cell/module) – and have established multi-GW cell production status (and are already embedded in the cell supply chain to the leading PV module suppliers) – are likely to be among the next wave of companies from China what will evolve into global module brands going forward. More on this later in the article. For now, the key takeaway from a capex standpoint is that is it critical to look at both cell and module capex by company, when benchmarking company technology ranking scores.
The analysis starts by going through all module suppliers, isolating total PV capex (sometimes called manufacturing capex) by quarter. The next step is to remove PV capex allocations to polysilicon, ingot or wafer stages, where necessary, leaving cell and module contributions; Capex(CM).
The quarterly capex data for each module supplier is then simply the sum of cell and module investments. No factor weightings are applied to cell and module contributions here, due to capex into cell and module capacity generally being equally advantageous in terms of technology-related health of any specific module supplier organization.
Capex is included across facilities, maintenance, upgrades and new production lines; in reality today, site costs for leading c-Si makers (especially when new sites are in China or Southeast Asia) are very low and often partially gratis on somewhat barter terms, when investing in new countries or new Chinese provinces.
For reference, when dealing with thin-film capex, it is necessary to normalize (or derate) capex allocations due to the much higher spending in recent years when adding GW-levels of new thin-film capacity. Derating factors are therefore applied (and adjusted annually) to thin-film capex contributions to allow direct comparison with typical values of leading Chinese c-Si module suppliers when adding GW-levels of new cell and module capacity. (If this is not done, the capex levels by First Solar, for example, would be excessively high and not aligned with new capacity levels ultimately coming online.)
For each module supplier (i), the respective quarterly cell/module capex values are then converted into t24m sums (previous eight quarter totals, at the end of any given quarter). This is essential when ranking the companies, as capex on a quarterly basis tends to be lumpy in nature. In addition, return on capex investments in the PV industry can be anywhere from six months to three years, depending on the company/country in question.
Capex scores (in the range 0-10) for each module supplier (by quarter) are then established by analyzing the data distribution and normalizing each quarter (u) for correct benchmarking purposes.
In fact, capex must be normalized in this way, in order to rank companies regardless of where the industry as a whole is on capex cycles: capex is by nature cyclic, and is normally one of the first leading indicators of a pending market downturn (as related to listed company valuations and profitability). Therefore, companies investing during downturns see higher scores, regardless of the total capex levels at the time.
The analysis of R&D spending by the module suppliers follows the same methodology as capex, discussed above. In contrast however to capex allocations being restricted to the cell and module stages of the value-chain, R&D entries are based on total PV spending, with the exclusion only of polysilicon contributions; R&D(PV).
This involves quarterly PV R&D spending being assigned to each module supplier, t24m values being determined at the end of each quarter, and scores being converted to a 0-10 scale based on normalization each quarter (v). Similar to the discussion on capex investments during downturns, priority is given to companies investing in R&D.
To establish the final technology-based quarterly score (T) by module supplier (i) for any given quarter, the two scores (capex and R&D spending) are combined through applying weightings (prioritized to capex), denoted by the t coefficients below. The last step is again to normalize each quarter to a 0-10 band, to standardize each of the S, C, and T contributions for the overall manufacturing health/strength parameter, M, through the quarterly coefficients k below.
The final expression then for the technology strength value for each company by quarter, can be written as:

Manufacturing technology (T) strength score output
Similar to the analysis covered in the previous articles within this series, the manufacturing technology (T) study can be adapted to look at only capex and R&D, or through further manipulation, capex across the different manufacturing zones discussed in the capacity feature.
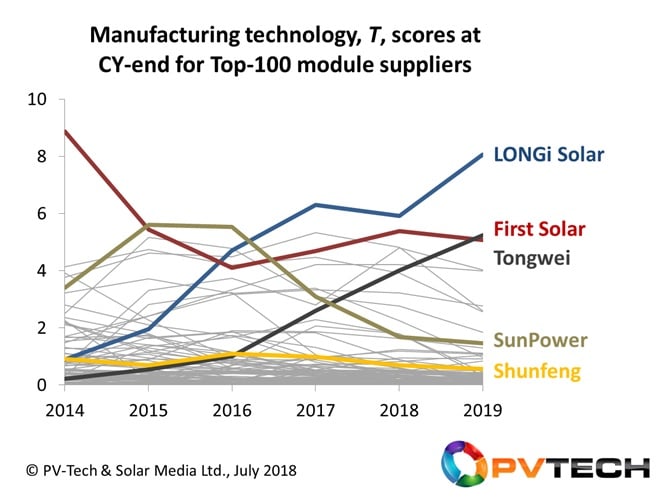
The graphic below shows PV module supplier technology scores from the top 100 companies in the industry today, with a few highlighted again to convey key trends arising from the analysis.
Capex and R&D spending are of course accounting terms, and investments are mostly connected to company turnover, profitability and investment-related financial metrics. During our research phase in building up the final module supplier bankability whitelist for the investment community, we explored the option of amalgamating capex and R&D within the financial part of the study, and isolating ratios such as return-on-capital-employed or return-on-invested-capital. This ultimately proved overcomplicated, and detracted from having a single universally-recognized financial health metric that ensured full audit trail understanding.
Other reasons for keeping capex and R&D spending within the manufacturing health section are explained in more detail when looking at the overall manufacturing analysis (M); the subject of the fourth article in the series.
The discussion on this now is in reference to the graphic shown above. Clearly, strong technology scores are more likely to come from companies that have healthy financial health status. This in part explains the segmentation of SunPower and Shunfeng in the graphic above, compared to the three other companies highlighted here: Tongwei, First Solar and LONGi Solar.
In fact, analysis alone of the technology strength score is also a strong leading indicator for future company success (or declines) when it comes to module supply levels and ultimate investment risk. This should come as no surprise, since capex and R&D investments are both investment-based and are placeholders for increased productivity, higher-performing product, etc. When time allows, it is our intention to return to the technology analysis here, and explore correlations over the past 10 years to see how true this hypothesis is.
However, simply looking at the trends between 2014 and 2019 of the highlighted companies above suggests that this term could be incredibly useful in isolation to investors seeking to project future investment risk for module makers during short-listing and final due-diligence ahead of supplier selection.
LONGi Solar’s upward trend, to become the clear technology-leader in our analysis (from 2017) is a prime example in this regard. The company was still setting out its transition from leading-wafer supplier to global module entrant during 2015-2017, and it is only in the past couple of years that LONGi has been added to the global bankable brand short-list of most-suitable suppliers.
First Solar’s cycle above is also fully consistent with the 2016 inflection point in the graphic coinciding with the start of the Series 6 expansion plans that will have the greatest impact on the company’s expected upside growth (on many counts) during 2020 in particular.
Finally, returning to the issue I discussed before about the value of extending the capex analysis of PV module suppliers to be inclusive of both cell and module capex investments, the inclusion of Tongwei above is another clear sign that the technology analysis alone could be one of the most important means of forecasting company-specific investment risk levels going forward.
Tongwei today is the leading cell producer globally, and the first to make a business out of being a 10-GW-plus annual producer; and with the same aggressive capacity expansion (and market-share growth) model that was seen several years ago by LONGi (from wafer supply standpoint). Tongwei’s move to module-status is lost in the news only because any GW-based plans pale into insignificance compared to the 10-20GW cell capacity growth strategy being unfolded.
Clearly, the overall manufacturing health score for PV module suppliers has other (and more important) contributions coming in particular from the supply (S) terms that is driven mainly by t24m module shipment globally to commercial, industrial and utility applications. In this respect, the overall (module supplier) score for Tongwei would be reset based on this factor, but as soon as module supply increases – and overseas projects are supplied to – the immediate bankability of the company as a credible module supplier becomes very real (assuming of course financial health is in place).
Previewing the next part of the article series
The next article in this series will focus on the overall manufacturing health score (M), the contributions of the individual supply (S), capacity (C), and technology (T) scores, the results of the regression analysis, and validation by way of comparing the results of each company between 2013 and 2019.
Ultimately, for companies to be ranked in the top categories of bankability for module supply (lowest investment risk) for large-scale solar deployment, both manufacturing and financial health status must be in place at the same time, and shown to be stable over periods longer than just the trailing quarter under investigation.
Attend PV ModuleTech 2019 to hear the first presentation on the findings
The full results of the overall study will be released by the PV-Tech market research team before the end of August, with the key findings presented, explained and discussed in the 45 minute opening talk I will be giving at the forthcoming PV ModuleTech 2019 event in Penang on 22-23 October 2019.
PV Tech’s bankability analysis series links are below
Part 1. PV-Tech research set to reveal investment grades for global PV module suppliers
Part 2. PV-Tech research reveals how to assess PV module suppliers’ capacity claims
Part 3. PV-Tech research establishes technology-leadership scorecard for top-100 module suppliers
Part 4. PV-Tech research reveals ranking tool for manufacturing strength of global module suppliers
Part 5. PV-Tech research ranks PV module suppliers by financial health
Part 6. First PV module supplier bankability ratings tool created by PV Tech research team


