This article represents the concluding part of a six-part series on PV-Tech over the past couple of weeks, introducing new methodology to allow leading PV module suppliers to be categorized, ranked and short-listed by manufacturing and financial strength metrics; ultimately providing an investor-risk (or bankability) profile of PV module suppliers for non-residential end-market selection.
Collectively, the six articles on PV-Tech.org provide transparency into the methodology used to assign investment risk to PV module suppliers selling to commercial, industrial and utility segments of the industry. The full dataset captures research findings by PV-Tech going back more than 10 years.
Try Premium for just $1
- Full premium access for the first month at only $1
- Converts to an annual rate after 30 days unless cancelled
- Cancel anytime during the trial period
Premium Benefits
- Expert industry analysis and interviews
- Digital access to PV Tech Power journal
- Exclusive event discounts
Or get the full Premium subscription right away
Or continue reading this article for free
The first five articles explained the full methodology behind the two key metrics/scores that are essential to ultimately rank PV module suppliers by way of a bankability ratings tool: manufacturing and financial health.
This article completes the jigsaw. It is the final part that allows readers to understand why a PV module supplier needs to have strong health scores for both manufacturing and financial operations to be bankable, at any given time.
The ongoing research and methodology tracking the bankability rankings of PV module suppliers will be explained in greater detail during forthcoming webinars I will deliver over 21-22 August 2019 (register here), and my opening talk at the PV ModuleTech 2019 conference in Penang, Malaysia on 22-23 October 2019.
Methodology overview
The entire methodology has been founded on the basis that PV module supplier bankability (B), is a function of the supplier’s manufacturing (M) and financial (F) health scores as:

where k is a scaling factor that maps bankability scores to a 0-10 band, m and n are power coefficients derived from regression analysis, and i is a variable that is module-supplier and time-period specific.
The first four articles covered the three key components (supply, capacity, and technology) within the manufacturing health score/ranking, M, variable; and how these components are combined to yield the M values for each company by quarter.
The previous article (number five in the series) focused on the financial health score/ranking, F, variable.
This article now deals with the end-goal of the whole study: forming a scoring system to grade PV module suppliers by bankability health scores between 0 and 10, and how these can be interpreted through a new dynamic bankability ratings tool that is directly analogous to the credit ratings system widely in use today to assess the creditworthiness and risk profile of governments and corporate entities.
By mapping PV module suppliers into clearly-defined, letter-graded categories (ranging from AAA-rated to C-rated), the new PV ModuleTech Bankability tool should finally provide a high-quality, independent and validated means of shortlisting potential module suppliers for commercial, industrial and utility site selection.
Bankability strength (B) score methodology
Let’s return now to the equation that underpins the entire PV module bankability study:
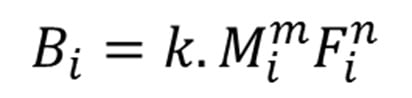
First, I will talk through why the relationship here is actually quite intuitive; in particular, in terms of the bankability score (B) directly scaling (proportional) to powers of each of the manufacturing (M) and financial (F) health scores.
Consider the following. To be bankable, a PV module supplier must first have manufacturing strength (for example through a strong demonstrated track-record of utility-scale shipments, having the capacity strength to sustain future shipment levels at the GW-level, and investing into capex and R&D). Additionally, the company must have demonstrated financial stability and health status over a prolonged period of time.
The two conditions must be met simultaneously. Being a shipment leader, but having poor financial standing, is not a condition that can ever meet leading-bankability status. Conversely, no matter how strong the company’s books are, a lack of product availability (reflected in a low manufacturing health score) ultimately renders the company as ‘unbankable’ (carrying excessive risk).
Weakness in either of the two variables (M and F) therefore precludes commercial-deployment bankability status, for any PV module supplier.
By default, the bankability score (B) must be derived from the product of the two terms, as opposed to any weighted summation. In short, no matter how strong manufacturing or finances are, risk-mitigation during investor due-diligence (supplier short-listing) cannot be compensated by just one of the M or F factors being at the upper end of its respective 0-10 score bands.
Once this premise is accepted, the challenge is simply to identify the scaling constant (k), and the power factors (m and n), within the above equation; and test this against different module suppliers, going back as far as ten years ago if needed.
Solving the bankability equation
The solution to the constants (k, m, n) turned out to be relatively straightforward, when looking at different observables derived from various PV module suppliers during the past few years, in addition to the current industry landscape today.
The constants should be time invariant, meaning that the equation can be applied to any company, at any point in time, and should always be a true reflection of that company’s bankability status, as seen by the industry.
The solution starts by considering the anchor points of the bankability, B, scoring band, from the lowest bankability score (zero) to the maximum (ten). The lower bound is self-explanatory:
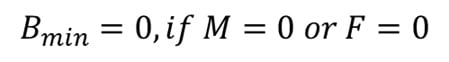
The conditions governing the upper band turned out to be slightly more complicated however. In theory, one would expect the maximum bankability score to be obtained as follows:
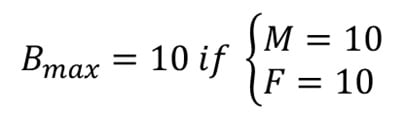
While this is theoretically possible, it is practically unattainable. If the coefficients are set using this boundary condition then few, if any, PV module suppliers would ever achieve a bankability score above 5/10. (Think of this like some kind of real-work reality-check. Being almost-perfect at two different things, at exactly the same time, never actually happens!)
To address this, it is necessary to remove any one-off outliers (extreme values) in the datasets for each of the M and F scores. In reality, it turns out that the issue is mainly one of removing F score outliers (as opposed to M values). This is now explained in more detail.
When looking at PV module suppliers to the industry over the past decade, leading companies rarely exceed a market-share of more than 10% of shipments. Indeed, to account for 90% of global annual shipments (confined simply to the commercial, industrial and utility segments), it is necessary to consider almost fifty different module suppliers. Moving to 95% coverage demands almost 100 different module suppliers to be analysed.
Therefore, the M scores are relatively bunched today within a band 1-8 (maximum, M=10). As such, there are no clear anomalies (or extreme score outliers) in the M category, especially when accumulating data for 95% of global shipments (about 100 module suppliers).
The variance is revealed however in the F score, with this being emphasized because finance dominates over manufacturing in final bankability ratings of PV module suppliers. (More on this below during the discussion of the power coefficients, m and n.)
The model is therefore adjusted to account for potential outliers, as it pertains to setting the maximum value for B, as shown in the equation above.
The solution to this is to introduce percentiles, which effectively allow the removal of the extreme outliers, with the maximum value of B now governed by the following conditions:
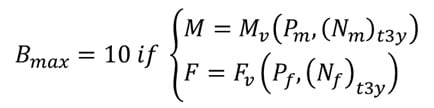
Here, Mv and Fv are the percentile values of M and F across a total or Nm and Nf data entries over a trailing three-year period (t3y), and Pm and Pf are the input percentiles for M and F.
If the percentile for either M or F is set to 100%, this is equivalent to simply using the maximum value seen by any company for either M or F during the past three years. As discussed above, this is not reality; for the F score to make sense in the overall bankability calculation, establishing the F percentile (number of extreme outliners to remove) is essential.
Once the percentile values are derived, the next issue is to set the ratio of the power coefficients, n and m. The solution is achieved relatively quickly by recognizing that financial health is always more important than manufacturing health (when dealing with supplier bankability).
Once n and m are derived, the solution to the scaling coefficient, k, is shown to be:
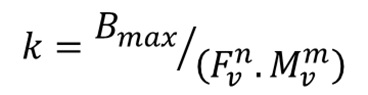
This completes the methodology overview, and how to generate the three constants that are required to calculate PV module supplier bankability scores (in a 0-10 band), given knowledge of the respective company’s manufacturing and financial scores, at any given quarter-end.
Introducing PV module supplier bankability terms & definitions
Before looking at the bankability scores for a sample group of GW-level PV module suppliers, it is essential that the final part of the model is explained. This involves putting classification, terminology and description to the numbers generated above.
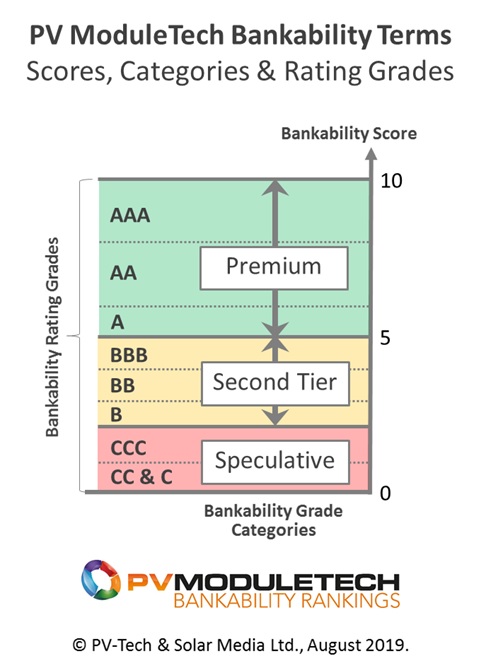
The bankability scores (0 lowest, 10 highest) fall into three pre-assigned grade categories; premium, second-tier, and speculative. The naming here is done such that module suppliers with bankability scores in the range 5-10 are placed in the upper, premium grade; in contrast, the lowest performers (scores between 0 and 2) are in the speculative grade. The middle grade is called second-tier, and has the companies with scores in the range 2-5.
Each of the three grades (premium, second-tier, and speculative) has three different rating grades (or simply ratings). For example, premium includes AAA, AA, and A ratings. This is shown clearly in the image below.
Therefore, the highest performers in the sector are referred to as AAA-rated (read as triple-A-rated). PV module suppliers with this rating label are likely to be setting benchmarks for all other PV module suppliers, across a wide range of operational metrics; not to mention getting a modest ASP premium through having a brand-value delta.
We elected to use letter-designation ratings, analogous to those issued by credit ratings agencies (such as Standard & Poor’s that can be seen here) when they assess the creditworthiness of entities (governments or companies, for example).
Credit ratings affect the likelihood of a company being approved for a loan. By analogy then, PV bankability ratings should affect module suppliers’ chances of being considered for any volume supply contract.
This is a key point; bankability scores/ratings are best used to form shortlists of companies as potential suppliers; third-party agencies then tick the final boxes (factory auditing, pre-shipment inspection, certification, full independent engineer due diligence, reliability testing, inspection, etc.); buyers also of course have price offers from different suppliers, and run their own ROI projections. Having a means however of sanity-checking the companies behind the offers, or knowing which half-dozen to focus on most, is hugely important.
Another good analogy to credit rating nomenclature arises when noting that credit takes time to build up, and as such, high scores/ratings reflect the entity’s track-record (to repay loans). Similarly, the module bankability ratings have a strong supply track-record element built in, with the leading companies being the ones that have the strongest brand ‘value’ in the industry at any given time, built up over time.
Indeed, the grade category ‘premium’ was so named because module suppliers at the upper end of this category are normally the ones with premium brand, resulting in premium ASPs compared to the rest of the industry.
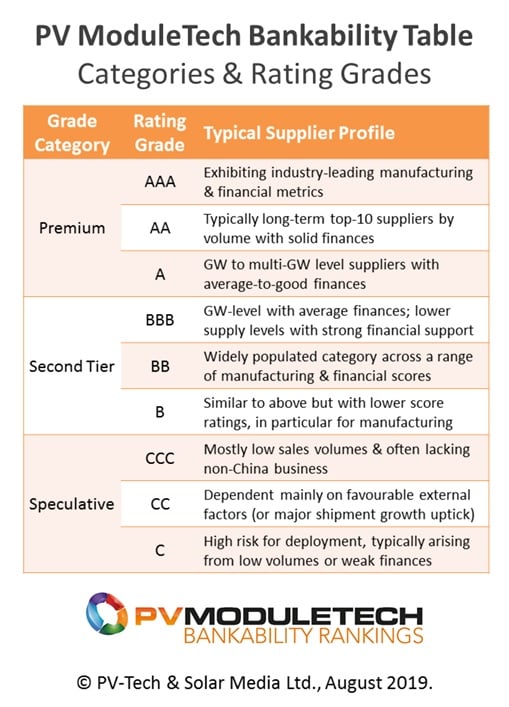
Complementing the image above (explaining credit rating grades), the nine bankability ratings are better understood through a brief description of each one. While simply a two-line summary in most cases, it nonetheless gives a quick check on the generic characteristics of the companies that share unique rating grade lettering.
This is shown in the image below. (Over time, the precise wording will certainly evolve, to be as succinct and accurate as possible.)
Bankability sample group study
During each stage of the six-article series, every effort has been made to validate the model; in particular, for the five scores across the manufacturing and financial health analyses, asking the question “does this match with what is seen in the industry, now and at any point in time during the past 3-5 years?”
Validation of the bankability ratings is undoubtedly the most important part of this exercise, prior to releasing (in the public domain) the findings as they relate to specific companies; and indeed ahead of periodic updates going forward.
By default largely, most articles posted on PV-Tech regarding the PV ModuleTech Bankability ratings over the next six months will feature aspects of ratings validation. In particular, every quarter when the bankability scores are updated for the PV module suppliers, validation must be done.
One of the initial validation checks done on the bankability scores and supplier ratings grades is now discussed and reviewed. Here, eight leading PV module suppliers were chosen, satisfying the following criteria:
• Annual module shipment levels >1 GW for the calendar year 2018
• Listing within Top-10 PV module suppliers by volume, for one or more of the past three calendar years
• (Specific to Chinese-based module suppliers) >10% annual module shipment volumes to overseas markets (non-China) during the past three years
• Claim of being in any third-party agency list, such as Tier 1, etc.
• Brand awareness across decision-making parties overseeing selection of large-scale utility solar site builds in excess of 50 MW
All suppliers satisfied at least four out of the five conditions, with many of them comfortably meeting all five.
The choice of the criteria above was important as part of our initial validation checks. Often, when a host of companies each claims the same thing (industry top-performer, top-10 supplier, tier-1 status, etc.), it is easy to conclude erroneously that there is little to choose between group members. Indeed, this is one of factors that prompted the bankability methodology to be developed in the first place.
There is an extra caveat introduced in the selection process. As opposed to choosing several companies with similar profiles today (in terms of module supply tactics and strategy), the eight companies were selected because they were considered to have different strengths and weaknesses (from the buyer’s perspective).
The graphic below shows the calculated bankability scores for the eight different module suppliers, over a ten quarter period to the end of Q1’19. The module supplier names are anonymized here: the main issue is to check validity at this point, not analyse companies per se.
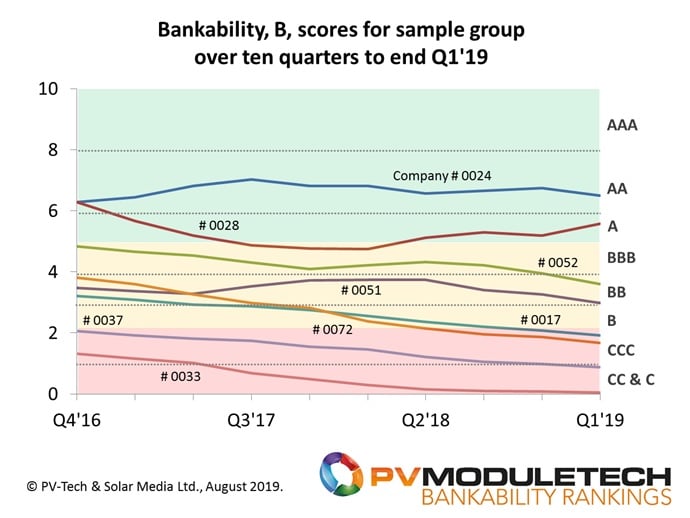
The graphic shown above turns out to be incredibly informative. It confirms – with crystal clarity – that the bankability scores/grades of companies (all producing and shipping GW-plus of solar modules each year) can indeed range from AA-rated to the lowest-grade and highest-risk category at the bottom.
It goes some way to debunk the myth that simply being in some random top-10 or tier-based table carries any real substance (other than membership of a group), or that being a GW-status module producer is something of value in today’s PV industry.
Over the next few months, graphs similar to the one above (colour-coded, with trended bankability scores and rating grades) will be commonplace in articles on PV-Tech, where specific companies are discussed and reviewed. In addition, since the ranking system methodology is ultimately of most use to module buyers/investors, I will provide clarity on how accurate various aspects of the model turn out to be, from a predictive forecasting perspective.
Getting more details about PV ModuleTech Bankability ratings
So far, during the two-week period where I have outlined the full methodology behind the PV ModuleTech Bankability rating system, I have been making a note of the most common questions that have come my way. It seems fitting to list these quickly now:
• Which module suppliers are the most ‘bankable’?
• Where does “my company” rank compared to Jinko?
• How many top-10 or tier-listed companies today are ‘unbankable’?
Over the coming months, hopefully these questions will be discussed in more detail. In the meantime, there are a couple of dates to note for the diary, when I will be speaking more on the new PV ModuleTech Bankability ratings and the suppliers featuring within the premium grade categories.
I will deliver online webinars over 21-22 August 2019 (register to watch here), and give the 45-minute opening talk at the forthcoming PV ModuleTech 2019 conference in Penang, Malaysia on 22-23 October 2019.
In particular, during the forthcoming webinar presentations on 21-22 August 2019, I will reveal for the first time which PV module suppliers fall into the highest PV ModuleTech Bankability ratings grade today!
PV Tech’s bankability analysis series links are below
Part 1. PV-Tech research set to reveal investment grades for global PV module suppliers
Part 2. PV-Tech research reveals how to assess PV module suppliers’ capacity claims
Part 3. PV-Tech research establishes technology-leadership scorecard for top-100 module suppliers
Part 4. PV-Tech research reveals ranking tool for manufacturing strength of global module suppliers
Part 5. PV-Tech research ranks PV module suppliers by financial health
Part 6. First PV module supplier bankability ratings tool created by PV Tech research team


