This article continues our series of features introducing new methodology that allows leading PV module producers to be categorised, ranked and short-listed by manufacturing and financial strength metrics; ultimately providing an investor-risk (or bankability) profile of bankable module suppliers for non-residential end-market selection.
This is the second of six articles on PV-Tech.org that will provide full transparency on the methodology used to assign investment risk to PV module suppliers selling to commercial, industrial and utility segments of the industry. The full dataset captures research findings by PV-Tech going back more than 10 years.
Try Premium for just $1
- Full premium access for the first month at only $1
- Converts to an annual rate after 30 days unless cancelled
- Cancel anytime during the trial period
Premium Benefits
- Expert industry analysis and interviews
- Digital access to PV Tech Power journal
- Exclusive event discounts
Or get the full Premium subscription right away
Or continue reading this article for free
The first article, PV-Tech research set to reveal investment grades for global PV module suppliers, introduced the research methodology, focusing on the supply strength ranking of PV module suppliers. This (second) feature focuses on the capacity factor used within the bankability rankings study.
The output from the overall analysis – accumulated by the PV-Tech research team over the past five years in particular – will form a key part of my opening talk at the forthcoming PV ModuleTech 2019 conference in Penang, Malaysia on 22-23 October 2019.
Methodology overview
The first article introduced the basic relationship between module supplier bankability (B), manufacturing (M) and financial (F) scores as:
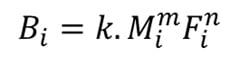
where k is a scaling factor that maps bankability scores to a 0-10 band, m and n are power coefficients derived from regression analysis, and i is a variable that is module-supplier and time-period specific. The manufacturing health score/ranking is expressed as:
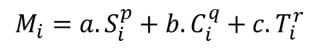
where a, b, and c are factor-dependent weightings, scaled to generate manufacturing health scores for each company by quarter (i) in a 0-10 band; S, C and T are the module supplier shipment, capacity and technology ratios introduced above; p, q and r represent power factors derived from regression analysis.
This article focuses on the capacity score (C) and how this is derived.
Manufacturing capacity (C) strength score methodology
The manufacturing capacity factor (C) ranks PV module suppliers, by looking at in-house cell and module effective quarterly capacities across different global PV manufacturing zones, and factoring in the access these manufacturing zones have at any given time to global module supply end-markets.
This type of analysis turns out to be incredibly insightful, and explains why the common practice of PV industry observers to consider one capacity number (often based on unsubstantiated nameplate single-entry data points) is both misleading and inappropriate within a changeable trade-barrier influenced global landscape where origin-of-manufacture is of the utmost importance.
First, I will explain some of the key issues related to capacity within the PV industry today.
Excluding thin-film PV technologies, all c-Si based module suppliers operate with different levels of backward-integration capacity, across cells, wafers and ingots. While various Chinese companies have subsidiary operations that produce polysilicon, no company today in the PV industry operates with a full value-chain model where every component is made in-house.
Across the ingot-to-module stages, the most critical parts in terms of module supply are cell and module production. Wafer supply has now become a China-centric commoditised offering, and crucially this part of the value-chain has been exempt from trade-related origin-of-manufacturing. Indeed, with more than 95% of c-Si wafers produced today within China, there is even less prospect of wafer supply being incorporated into any meaningful tariff-related policy.
Moreover, such trade-related duties have typically focused on the cell and module segments of the value-chain. Therefore, in assessing company-specific capacity-based strength metrics, it is the cell and module stages that are important to evaluate. This becomes further justified when recalling that module specifications are mostly driven by cell performance and quality.
In addition to the need to have high levels of in-house cell and module capacities, most Chinese c-Si module suppliers have routinely relied upon strong third-party outsourcing of cells and modules.
At the two extremes of the Chinese module supply practice are the fully-integrated in-house supply-constrained model, and the so-called ‘fabless’ alternative.
Leading multi-GW module suppliers – that adhere to using only in-house produced cells and modules – are the exception within the PV industry today. Indeed, the practice of relying on third-party companies for production has only increased in recent years, with Southeast Asia based companies often being called upon when shipping modules without prohibitive duties to the US (and until recently, to Europe).
By default, the only multi-GW thin-film producer (First Solar) is mandated to use in-house product, as a result of being technology-differentiated; this is an exception to the rule today, with the company being the only truly-differentiated alternative to non-residential (commercial, industrial and utility, or CIU) applications.
The fabless model – where all manufacturing is outsourced – remains popular within adjacent technology sectors (in particular, the semiconductor industry), but has been largely ineffective until now within the PV industry. The only company that sought to pursue a cell/module fabless model was SunEdison several years ago.
Other companies (including several Japanese module suppliers) did shift to strong outsourcing in an attempt to stay competitive (quasi-fabless), but such efforts were largely short-lived. In reality, a host of factors has prevented the fabless model working in the PV industry, including single-digit production margin constraints, and the need to quickly adjust to market dynamics resulting from technology and tariff related issues.
In assessing the relative strengths of module suppliers, in terms of manufacturing capacity, it proved necessary to fully understand how much effective cell and module capacity was owned by each company, and across which manufacturing zones globally. In particular, the levels of cell and module capacity by zone turns out to be crucial in assessing which end-markets are on offer through in-house cell and module production. The growth of cell and module capacities across Southeast Asia in recent years illustrates this point succinctly.
The analysis of manufacturing capacity strength (C) starts by splitting each company’s effective cell and module capacities across eight pertinent manufacturing zones globally: China, Taiwan, India, Japan, Southeast Asia, the US, Europe and the Rest of the World (RoW). These locations are chosen in part from a legacy manufacturing standpoint (in particular Japan), and crucially because trade-related import barriers tend to differentiate between cell and modules produced and shipped from these areas (origin-of-manufacture).
This type of segmentation is also important because ultimately the strength of in-house capacity depends on the served addressable market (SAM) available; namely which end-markets are absent of prohibitive import conditions at any given time.
This has been most pronounced in the case of China over the past decade. As such, it can be concluded a Chinese company having multi-GW of in-house cell and module capacity only in China sees a lower SAM for its factory output, compared to a competitor that has domestic and overseas manufacturing capability. While this alone is a simplistic case-study, the reality is a rapidly evolving global landscape that needs a robust methodology constructed in order to deal with changes by manufacturing zone and regional end-market supply (export and import).
The first part of the analysis here therefore requires the effective quarterly cell and module capacities (Cap) by quarter, for the top-100 module suppliers globally, to be segmented into each of the eight manufacturing zones (p=1…8), as outlined above.
For reference, effective capacity refers to the available/ramped capacity and its maximum productivity levels if operated 24/7. Very few fabs operate under these conditions in the PV industry, with only First Solar having a consistent track-record of fab productivity in the 95-100% range over a multi-year time period. The key issue here though is to differentiate between erroneous and misleading capacity figures that are all too commonly used within the PV industry, such as nameplate capacity or ‘available’ capacity (which is often no more than an ambitious summation of in-house and third-party capacities that can be called upon if needed).
Effective capacities in general go up and down every quarter, due to efficiency/power improvements at the module level, technology upgrades, debottlenecking, routine maintenance, or temporary factory mothballing.
A key indicator of capacity definition used within the industry by any company/observer can be understood quickly, by noting that effective capacity figures are different every quarter: erroneous nameplate or ‘available’ capacity figures are often quoted to the nearest 100MW or GW and don’t change, by comparison.
Another guide may come from related utilization rates cited that exceed 100%, reflecting inaccurate capacity allocations: capacity conversion is a more accurate means of quoting utilization rates in practice.
With the eight segmented module capacities (Cap) by manufacturing zone location established, the next stage is to determine how much effective in-house cell capacity is available to each of the module suppliers in these zones.
This is important as it allows us to differentiate between modules produced by any company (in any zone) using in-house cells (IHC) or third-party cells (TPC). As discussed above, a major part of module quality, performance and reliability can be traced back to the origin of cell manufacturing; additionally of course, module trade-barriers routinely extend to cell component origin-of-manufacture.
The resulting module capacity (Cap) value by company (i) by manufacturing zone (p=1…8) can therefore be expressed as:
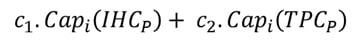
where the c coefficients are weighting factors that depend on whether module capacity uses in-house cells made in the same manufacturing zone, Cap(IHC), or by third-party cell producers, Cap(TPC).
This clearly promotes the strength of module suppliers that use in-house made cells only, produced local to module assembly activity. This is entirely consistent with how the industry operates today, and is a key issue for any investor-led due-diligence process as it pertains to module quality and bill-of-materials integrity.
The weighting factors, c, are qualitative data entries by nature, and can be adjusted by quarter or by manufacturing zone depending on how important in-house vertical integration of cells and modules is. The precise relative weighting between the factors turns out to be somewhat secondary within the overall bankability studies, and as such it is not essential to overcomplicate this part of the analysis, other than to have a means of differentiating between IHC and TPC supply-chains.
For reference, First Solar’s manufacturing is split up into cell and module capacities, although a single thin-film line incorporates the equivalent of c-Si cell/module stages. By default therefore, all First Solar product is cell/module matched, as it is for other thin-film makers in general.
The next stage of the analysis is the most important and valuable part of the overall capacity strength factor studies, because it introduces the impact of trade (export) restrictions on modules produced within any of the eight (p=1…8) manufacturing zones shipped to any of the six (j=1…6) end-market regions (Reg) that were introduced in the first part of the article series before.
Simply put, the value of having module (and cell) capacity in any part of the world is only as useful as the SAM available at any given time, factoring in trade-barriers that tend to be somewhat binary in nature when it comes to market accessibility (either the end-market region is ‘open’ or ‘closed’ with limited scope for any middle-ground).
One of the most insightful example of this relates to Chinese cell/module capacity (one of our eight manufacturing zones) and shipments into Europe (one of our six end-market regions). Prior to the establishment of the minimum import pricing (MIP) constraints imposed by the European Union on Chinese imports, Europe was fully accessible to Chinese produced modules. Once MIP was imposed, shipments from China to Europe collapsed to near-zero. Then when the MIP was removed, Europe than became fully-accessible again to Chinese produce.
In order to restate module capacity by company/quarter within the eight manufacturing zones globally, each capacity value (obtained through the summed term above) is multiplied by an end-market ‘access-related’ factor that is both manufacturing region and end-market specific.
To do this, the module sum factor (above) for each module supplier is multiplied by a quarterly-variable term based on combining the total quarterly CIU demand (Dem’) (for each of six end-market segments (j=1…6) for shipments) with a qualitative access percentage term (Access) that defines the availability of end-market j for module production in manufacturing zone p at any given point.
For example, returning to the Chinese module capacity example above, where the manufacturing zone is China, then China-specific access percentage terms would be 100% for China (naturally), and near-100% for regions such as Europe (today), Japan and most of the RoW sub-segments. By contrast, percentage levels would be very low for shipments to the US market, and fluctuating for supply to the Indian market.
The pro-rated regional contributions for each manufacturing zone are finally scaled by dividing by the total global CIU market demand in each quarter. This overall scaling factor can be expressed as:
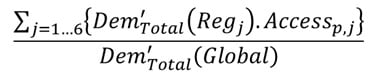
Therefore, this type of analysis not only adjusts module capacity by manufacturing zone, it also scales the size of served end-market by the importance of each region, by looking at the ratio of the demand (CIU) from that region and the total CIU demand each quarter.
The steps above turned out to among the most insightful within the overall study, in building up the manufacturing strength of PV module suppliers in the industry. This analysis clearly takes capacity assessment (previously largely misunderstood and erroneously presented) to a new level of scrutiny, and finally allows for capacity to be valued based on where the product is made, how much incorporates in-house and local cell supply, and which end-market is being targeted; for all module suppliers, by quarter.
The final capacity score (C) of each module supplier is then simply the sum of the scores derived for all eight manufacturing zones, by quarter. The full equation can be written finally as:

where k is a variable quarterly scaling factor, to map capacity scores into a 1-10 band; again based on distribution and standard deviation checks done by quarter.
It should also be pointed out that the capacity analysis here is confined to quarter-only data points, and not any trailing for forward-looking time periods (as was entirely valid for the supply/shipment analysis before). This is done because capacity strength is an instantaneous variable (has a specific value at any given moment in time) that is entirely dependent on regional trade-access conditions.
Manufacturing capacity (C) strength score output
Similar to the analysis covered in the manufacturing supply (S) analysis outlined in part 1 of this series, the manufacturing capacity (C) study yields a vast quantity of benchmarking for different PV module suppliers, when isolating manufacturing zones and end-market shipment regions over different time periods.
For now however, we look at the final C values for PV module suppliers, choosing to show year-end values for simplicity, although the analysis of course tracks scores by quarter.
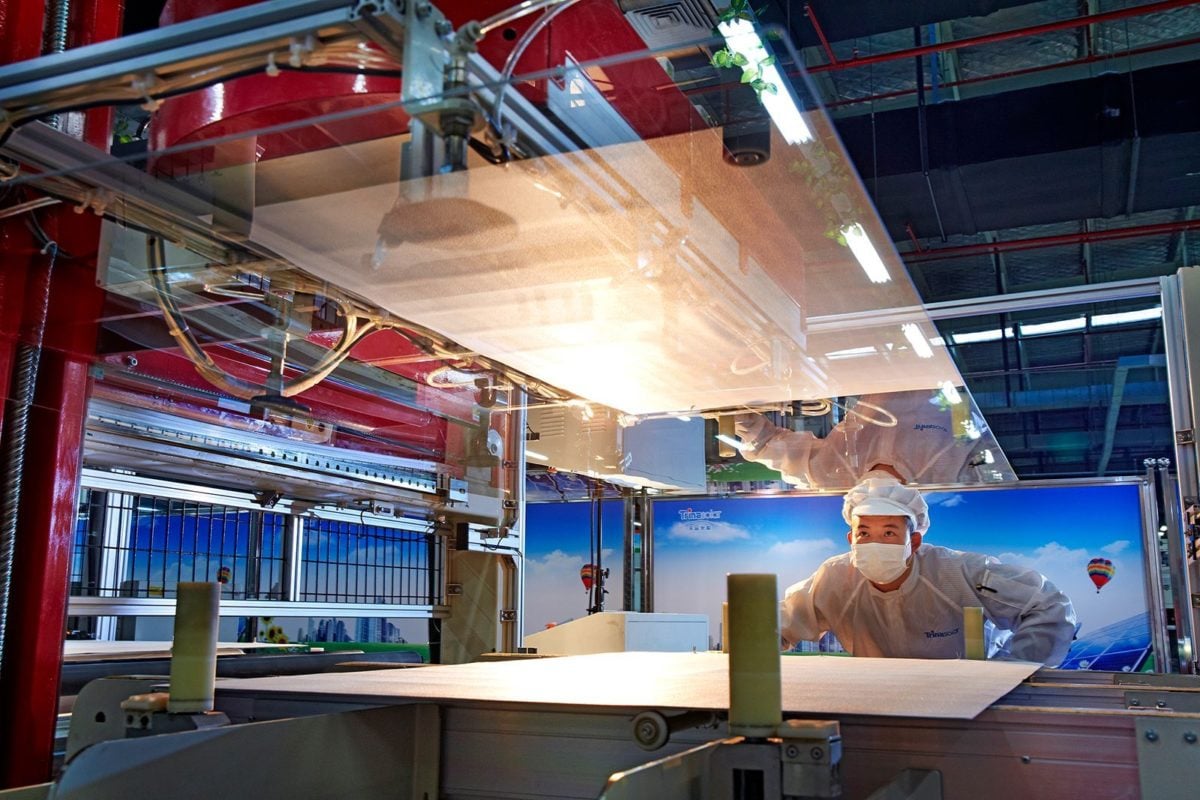
The graphic below captures PV module supplier scores from the top 100 companies in the industry today, with a few highlighted again to convey key trends arising from the analysis.
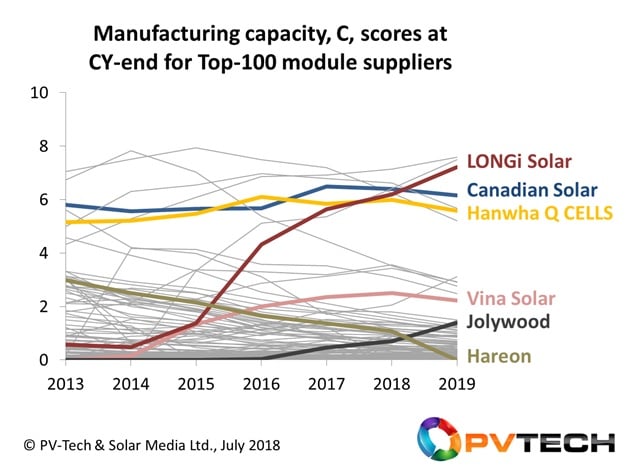
While the highlighted companies show a range of different fortunes for PV module suppliers’ capacity strength factors, the most interesting ones to discuss are those of Canadian Solar and Hanwha Q CELLS. Each of these companies has maintained capacity effectiveness by having a flexible strategy that allows modules made in different manufacturing zones to be prioritised at different times, depending on which end-markets are favourable to origin-of-manufacture.
The case of Hanwha Q CELLS is perhaps the most robust in this regard, with the company able to adjust product availability from China, Korea, Malaysia (and now the US) as and when trade conditions apply; only companies with strong balance sheets can purse this strategy for any meaningful length of time.
Previewing the next part of the article series
The next article in this series will focus on the last term in the manufacturing health score analysis; technology (T). This allows us to incorporate R&D spending (confined to PV operations) and capex (restricted to cell and module stages) for each of the 100-plus module suppliers under review, again analysed by quarter.
The conclusions will be shown during the article to reveal the unique way in which R&D spending and capex (the hallmarks of technology leadership in other technology sectors) impact on PV manufacturing strength and module bankability rankings.
Attend PV ModuleTech 2019 to hear the first presentation on the findings
The full results of the overall study will be released by the PV-Tech market research team before the end of August, with the key findings presented, explained and discussed in the 45 minute opening talk I will be giving at the forthcoming PV ModuleTech 2019 event in Penang on 22-23 October 2019.
PV Tech’s bankability analysis series links are below
Part 1. PV-Tech research set to reveal investment grades for global PV module suppliers
Part 2. PV-Tech research reveals how to assess PV module suppliers’ capacity claims
Part 3. PV-Tech research establishes technology-leadership scorecard for top-100 module suppliers
Part 4. PV-Tech research reveals ranking tool for manufacturing strength of global module suppliers
Part 5. PV-Tech research ranks PV module suppliers by financial health
Part 6. First PV module supplier bankability ratings tool created by PV Tech research team
")


