
This article continues our series of features introducing new methodology that allows leading PV module producers to be categorized, ranked and short-listed by manufacturing and financial strength metrics; ultimately providing an investor-risk (or bankability) profile of PV module suppliers for non-residential end-market selection.
This is the fourth of six articles on PV-Tech.org providing full transparency on the methodology used to assign investment risk to PV module suppliers selling to commercial, industrial and utility segments of the industry. The full dataset captures research findings by PV-Tech going back more than 10 years.
Try Premium for just $1
- Full premium access for the first month at only $1
- Converts to an annual rate after 30 days unless cancelled
- Cancel anytime during the trial period
Premium Benefits
- Expert industry analysis and interviews
- Digital access to PV Tech Power journal
- Exclusive event discounts
Or get the full Premium subscription right away
Or continue reading this article for free
The first article, PV-Tech research set to reveal investment grades for global PV module suppliers, introduced the research methodology, focusing on the supply strength ranking of PV module suppliers. The second feature, PV-Tech research reveals how to assess PV module suppliers’ capacity claims, explained how these companies can be ranked based on their capacity strength. This was followed by the feature titled PV-Tech research establishes technology-leadership scorecard for top-100 module suppliers that examined technology leadership.
Collectively, these articles covered the three key contributions to the overall manufacturing health score of PV module suppliers. How these parts are combined to form the final manufacturing health output is the subject is this, the fourth article in the series.
The ongoing research and methodology tracking the investment rankings of PV module suppliers will be explained in greater detail during my opening talk at the forthcoming PV ModuleTech 2019 conference in Penang, Malaysia on 22-23 October 2019.
Methodology overview
Previous articles revealed the basic relationship between module supplier bankability (B), manufacturing (M) and financial (F) scores as:
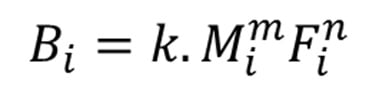
where k is a scaling factor that maps bankability scores to a 0-10 band, m and n are power coefficients derived from regression analysis, and i is a variable that is module-supplier and time-period specific. The manufacturing health score/ranking is expressed as:
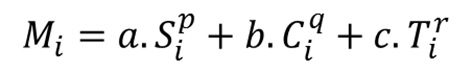
where a, b, and c are factor-dependent weightings, scaled to generate manufacturing health scores for each company by quarter (i) in a 0-10 band; S, C and T are the module supplier shipment, capacity and technology ratios introduced above; p, q and r represent power factors derived from regression analysis.
With the S, C, and T scores explained in the first three articles, we now focus on how these are combined to form the M values for each company at each quarter-end.
Manufacturing strength (M) score methodology
The analysis considers the dependence of the three manufacturing variables (supply, capacity and technology), treating the contributions as independent quantitative factors, and finding solutions to the coefficients (a, b and c) and the powers (p, q, and r) shown above.
Of course, in practice, there is correlation between almost everything related to a specific company’s operations (across the full range of inputs within any financial and manufacturing analysis), but the choice of discrete supply, capacity and technology factors within the manufacturing score analysis does have resonance with PV module suppliers’ modus operandi, as discussed now.
Module supply levels are driven by in-house capacity to a large degree, but almost every c-Si module supplier operates with some degree of flexibility where third-party outsourcing is used. For some PV module suppliers, third-party supply dominates module shipments for example.
This was always a feature for Chinese based module suppliers in the past (although rarely disseminated in words), but moved to a new level when Europe and the US imposed tariffs on Chinese-produced modules. This in turn stimulated a multi-GW capacity allocation across various OEM suppliers in Vietnam (and to a lesser degree, the whole Southeast Asia region). Japanese companies also use this model frequently.
This was the principal reason for decoupling the supply (S) and capacity (C) terms. In short, module supply can vary significantly when compared to each company’s in-house capacity or, moreover, capacity conversion (utilization) rates.
Next, the degree of correlation between the technology factor (T) and other manufacturing terms meant that the decision to decouple the dependence of technology from other variables was more obvious. Capex and R&D investments should certainly be treated in isolation for a host of factors in the PV industry. Here are a few reasons now.
Many companies (especially new entrants seeking to commercialize a disruptive technology type) often burn capex and R&D spending for several years, but fail to translate this into any meaningful shipment volumes. Also, Chinese companies have taken capex spending on c-Si additions to incredibly low levels today, and are also prone to have effective in-house capacity increments through absorbing mothballed or zombie-based facilities (zero cash spend) after restructuring of bankrupt entities. Also, there are large variances in R&D allocations, depending simply on the location of corporate headquarters. Most Chinese companies for example spend a fraction of a percentage point on R&D every year; by contrast, western PV companies tend to allocate 3-5% of annual revenues (or higher) to R&D spending, regardless of capex/industry cycles.
To keep the statistical overview to a minimum, I will bypass the workings, and move straight to the validation stages.
One way to understand the dependence of the S, C and T variables is to consider the final model accuracy (goodness-of-fit) for the supply, capacity and technology terms. This is shown in the figure below (two upper graphs and the lower-left one). For each of these graphs, the value of S, C and T is plotted (x-axis) against the original qualitative entries for each company’s M scores (y-axis), with the sold line fit based on the final terms a.Sp, b.Cq, and c.Tr, scaled to the 0-10 scoring band.
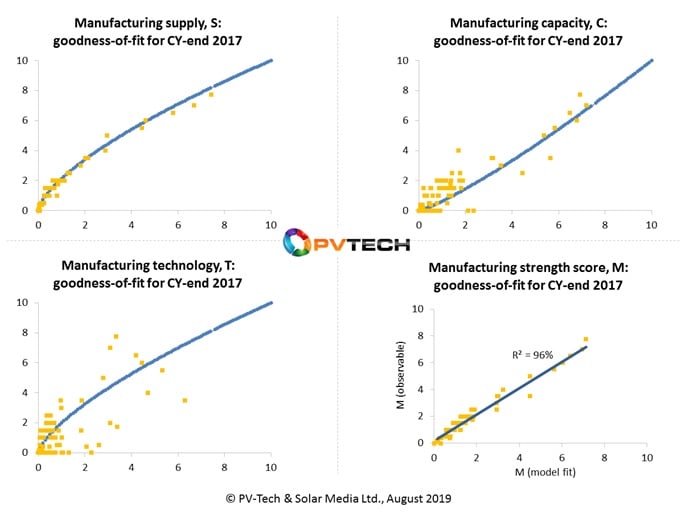
The scatter plot variation across the S, C, and T graphs goes some way to backing up the initial discussion in terms of the dependence of S, C and T on the observable, M: strong dependence of the first term (supply, S); low correlation arising from the technology term, T. Essentially, the closer the scatter points are to the line fit, the stronger the dependence.
Basically, the profile of the curves, in each of the S, C, and T plots above, drives the power factor determination for the variables. The coefficients are then derived by combining the power dependency of each variable with the corresponding data fit accuracy and the 0-10 scaling inputs (to ensure all M values fall into this range). Collectively, the coefficients and the power factors form the overall weighting of each variable, S, C, and T. (It should be pointed out that the overall weightings by default must be positive in value. There are many case-studies in the PV industry to support this point.)
The final graphic above (lower-right) provides the last check on the analysis (validation). The fit between the original qualitative M values (observable, y-axis) should ultimately be as close to a 1:1 linear fit, when calculating M using the modelled equation for M (after all coefficients and factors are determined), plotted on the a-axis.
The next major validation of the analysis involves comparing company-specific scores over a multi-year period until now, and seeing if the scores fully capture the manufacturing strengths as seen by the industry at large.
Manufacturing strength (M) score output
Across all the articles so far in the bankability study/methodology, we have sought to show validation of the approach by looking at the overall scores derived from the different metrics used. Supply, capacity and technology graphics to this end were discussed in the previous three articles of the series. Different companies were selected to validate the analysis, at each stage.
The graph below follows this validation process, by highlighting some of the major PV module suppliers to the industry today, and seeing how their manufacturing strength (M) scores have varied over the past five years.
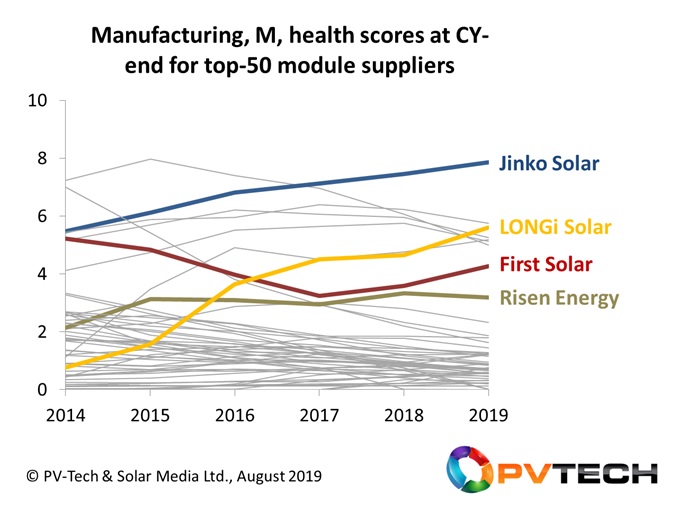
In reference to the above graph, I have highlighted four leading PV module suppliers (all top-10 by module shipment volumes in 2018/2019 to the non-residential end-market segments). Let’s check and validate the analysis for these four companies now.
JinkoSolar’s manufacturing strength growth has indeed been a carefully-considered ramp of in-house wafer, cell and module capacities, with frequent capex allocations and an uptick over the time period to R&D spending. The prudent choice of capacity located within China and across Southeast Asia has also been key to maximizing the value/strength of its manufacturing base at any given time. The net result is evident in the graphic by viewing the gradual Y/Y manufacturing strength score growth, ultimately confirmed by the delta between JinkoSolar’s end-2019 score and the rest of the industry.
LONGi Solar’s manufacturing scores over the past five years confirms the rapid manufacturing strength growth (scoring approximately 1/10 in 2014 to about 6/10 in 2019), and the upward trending in particular during 2019 that is setting up the company to be the second strongest module supplier from a manufacturing perspective, going into 2020.
First Solar’s manufacturing strength cycle is entirely consistent with the company’s manufacturing operations over the past five years, and has been discussed during previous articles within this series. The uptick in manufacturing strength scores from 2017 is in contrast to many of the other multi-GW (c-Si) module suppliers that are having to reset manufacturing operations in 2019 (as shown by the range of downward trend lines in the upper half of the graphic above). The uptick in manufacturing strength scores from First Solar during 2017-2019 is consistent with the company being largely sold-out today for its manufacturing output for the next couple of years, and reveals that the model here is also very good for predictive forecasting.
Finally, I have chosen to look at Risen Energy in the graphic above. Risen is one of several Chinese-headquartered PV module suppliers that has been operating the past few years with multi-GW module supply levels, but somewhat deprioritizing manufacturing investments against module supply volume levels (in-house and third-party blended) and downstream investment/EPC activity. The manufacturing score trend for Risen reflects this accurately, with modest long-term performance, aligned with manufacturing in-house kept at levels needed to support its downstream drive, but not subject to any major swing Y/Y.
We have gone through this type of anecdotal validation for more than 50 of the leading PV module suppliers today. In each case, the score at any given time (year-end, quarter-end) for the company’s manufacturing health (from 0 to 10) not only confirms our previous assessment of the company in question, but also provides new insights from a benchmarking perspective.
At this point in the series of articles, we have now developed a robust methodology to allow us to score all PV module suppliers by their manufacturing strength. We will return to using the M scores in the final article, when pulling together ultimate bankability scores for the PV module suppliers.
Previewing the next part of the article series
Two more articles will be released in the coming days, bringing the six-article set to a close. The next article (number five) will look at how PV module suppliers can be ranked purely on financial strength (the F values in our analysis).
The final article will explain how the manufacturing strength (M) and financial strength (F) values are combined to form an overall bankability/risk score for PV module suppliers, offering the first fully-researched benchmarking tool for investors, developers, EPCs, and asset owners of global solar PV sites today.
Attend PV ModuleTech 2019 to hear the first presentation on the findings
The full results of the overall study will be released by the PV-Tech market research team before the end of August, with the key findings presented, explained and discussed in the 45 minute opening talk I will be giving at the forthcoming PV ModuleTech 2019 event in Penang on 22-23 October 2019.
PV Tech’s bankability analysis series links are below
Part 1. PV-Tech research set to reveal investment grades for global PV module suppliers
Part 2. PV-Tech research reveals how to assess PV module suppliers’ capacity claims
Part 3. PV-Tech research establishes technology-leadership scorecard for top-100 module suppliers
Part 4. PV-Tech research reveals ranking tool for manufacturing strength of global module suppliers
Part 5. PV-Tech research ranks PV module suppliers by financial health
Part 6. First PV module supplier bankability ratings tool created by PV Tech research team


