
PV Tech has been covering analysis of R&D expenditures of PV manufacturers for over a decade. This blog looks at some of the key trends, which are being detailed in full in the forthcoming edition of technical journal Photovoltaics International.
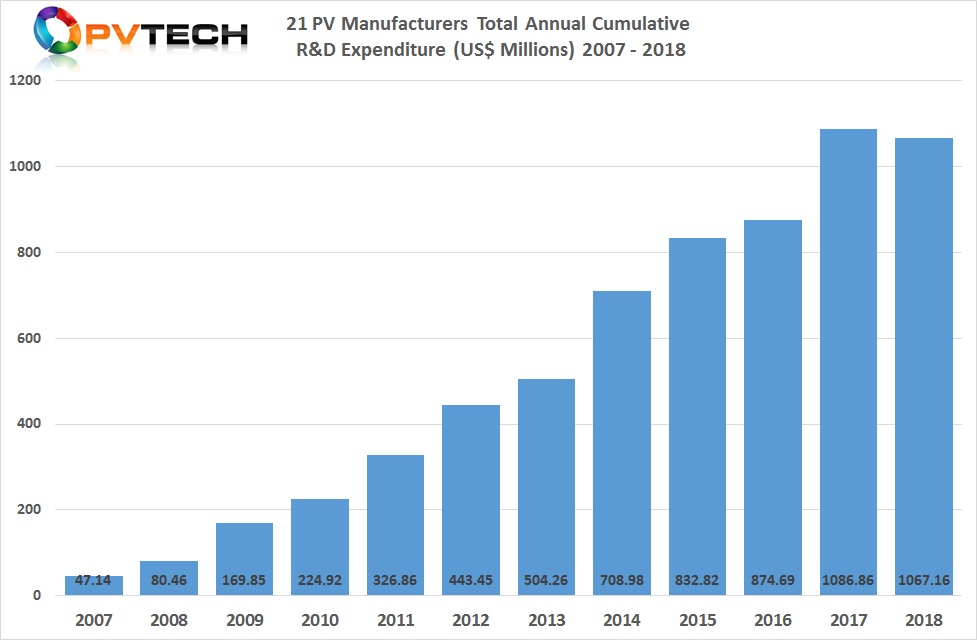
This is the second sequential year that R&D spending exceeded the US$1.0 billion level, although down slightly from US$1,086.86 million (US$1.08 billion) cumulative annual R&D spending of these 21 key PV manufacturers, in 2017.
Try Premium for just $1
- Full premium access for the first month at only $1
- Converts to an annual rate after 30 days unless cancelled
- Cancel anytime during the trial period
Premium Benefits
- Expert industry analysis and interviews
- Digital access to PV Tech Power journal
- Exclusive event discounts
Or get the full Premium subscription right away
Or continue reading this article for free
Spending pattern divergence
It is interesting to note that R&D spending doubled over a five-year period, growing from 2013 (US$504 million) to 2017 ((US$1.08 billion). Almost all 21 PV manufacturers under analysis were public in 2013 and all had reached that status by 2014.
However, a continued trend since 2014 has been the growing number of companies that lowered R&D spending, compared to those increasing spending on a year-on-year basis.
Only two companies lowered R&D spending in 2014, while the crossover point was reached in 2017, when 10 companies reduced spending compared to the previous year. This trend continued in 2018, as for the first time the number of companies lowering R&D spending (11) exceeded the number (9) increasing spending on this front.
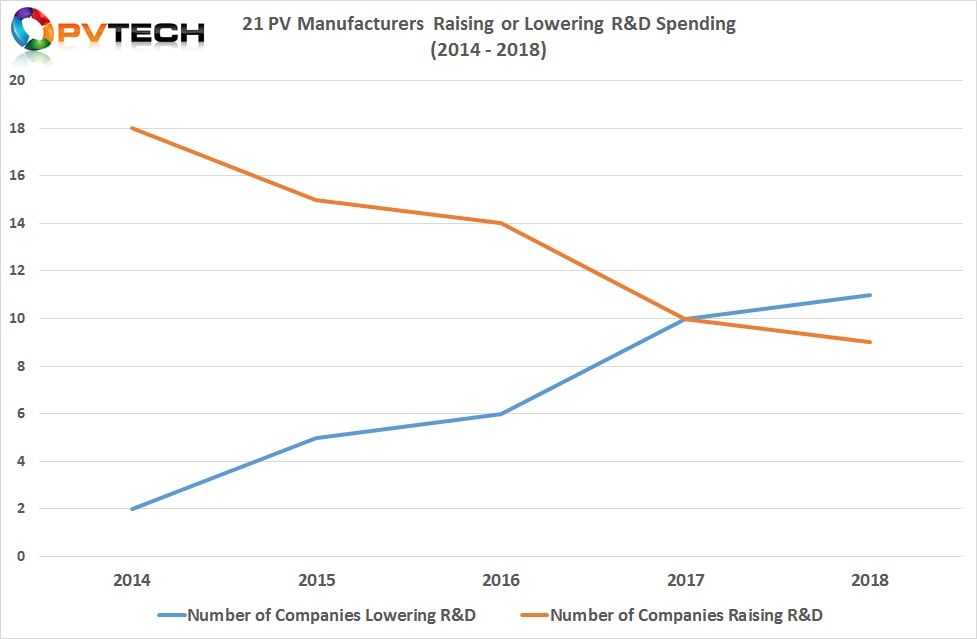
There are also two companies (First Solar and Yingli Green) that have lowered spending for four consecutive years since 2015.
In the 2018 analysis, two companies (Eging PV and Hareon Solar) have lowered spending for three consecutive years, while two companies (ZJ Sunflower, Wuxi Suntech and ) had lowered spending for two consecutive years.
The spending pattern divergence is primarily driven by the financial condition of some of the companies, such as Yingli Green, Hareon Solar, SunPower and others in the past.
However, the growing number of companies reducing spending in 2018, is also due to the weaker downstream PV market in China, after the Chinese government announced the ‘531 New Deal’ that put a halt to utility-scale and DG markets, as installations were viewed to have far exceeded plans and the market was subsequently overheating.
It is also interesting to note that due to this trend, only two companies since 2012 (LONGi Group and Zhongli Talesun) have consistently increased R&D spending, year-on-year.
Other companies that increased spending in 2018, included: JinkoSolar, Canadian Solar, SunPower, Tongwei, Hanergy Thin Film, URE, TZS and Comtec.
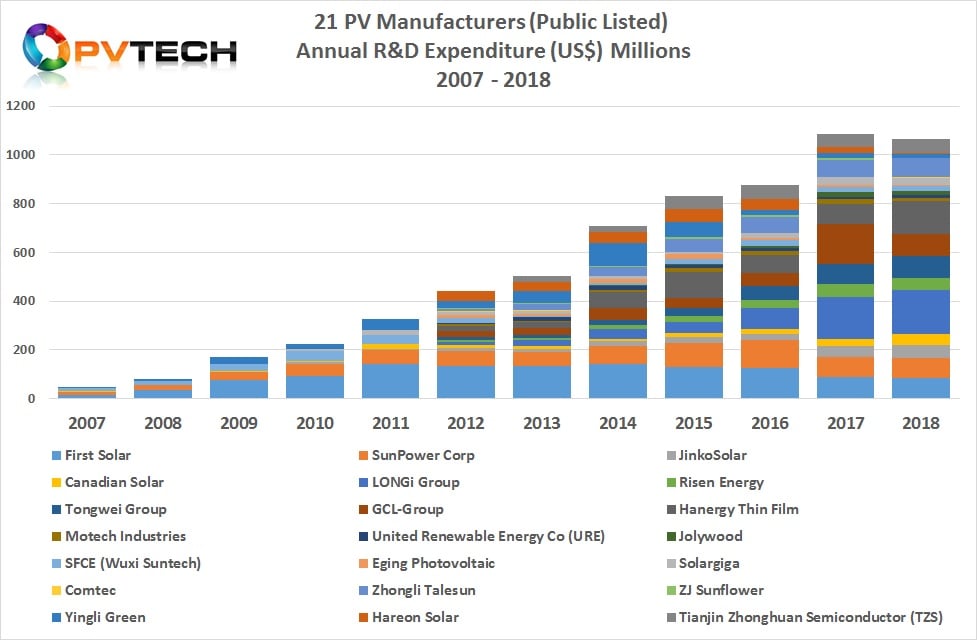
The chart below covers the last five years of annual R&D spending of the 21 key PV manufacturers.
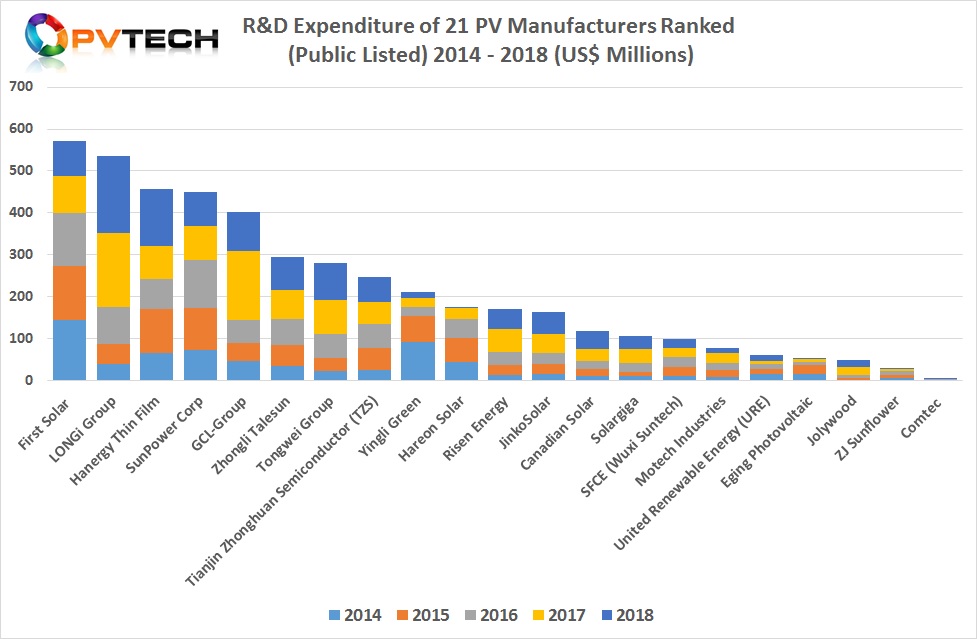
The chart shows a group of five companies (First Solar, LONGi Group, Hanergy Thin Film, SunPower and GCL Group) are clearly separated from the pack by a minimum of over US$100 million in cumulative R&D spending over the last five years.
Despite First Solar and SunPower dropping in the annual rankings, the changes over a five-year period are less pronounced for First Solar, which remains the cumulative R&D spending leader.
These companies are in the high US$500 million spending range through to the low US$400 million spending range, over the last five years.
However, SunPower’s position dropped two places in the 2018 rankings and has also been replaced by LONGi Group and Hanergy Thin Film in the last five year period. However, GCL Group was closing in fast in SunPower until a significant reduction in R&D spending took place in 2018.
LONGi Group and Hanergy Thin Film have been two of the three fastest growing companies in terms of R&D spending, notably in the last three years as shown in the chart.
The chart also highlights that three companies (Zhongli Talesun, TZS and Tongwei Group) have formed a second strong group accelerating R&D spending in the last four of five years.
Zhongli Talesun, TZS and Tongwei Group have an R&D spending range between the very high US$200 million level to mid US$250 million level.
Below TZS, things also look interesting as the low levels of spending by Yingli Green in the last three years highlight its declining position in the rankings, while Hareon Solar collapsed.
That means the accelerated R&D spending by Risen Energy, JinkoSolar and Canadian solar in the last two years underscores the ability to move ahead of Yingli Green very soon.
However, it also indicates that they remain a significant distance behind the second leading pack of Zhongli Talesun, TZS and Tongwei Group. Despite the potential to climb slowly up the ranking, primarily because otherS are falling by the wayside, there is every chance the gap to the second group will widen, locking the two major SMSL members in lower middle range rankings.
This may also be exacerbated by the expected return of two other SMSL members, Trina Solar and JA Solar into the R&D analysis in 2019, as they return to Chinese stock markets.
As for those companies below Canadian Solar, five years of R&D spending have mainly highlighted the chasm to the lead and secondary leadership group that increasingly looks insurmountable.
On a side note, we always get questions over the fact that we have previously not published data and charts related to companies' R&D expenditure as a percentage of revenue. In the past, a key reason was the almost universal rule that companies' R&D expenditure as a percentage of revenue lay in the 0.8%-to-3% range. The exception had always been First Solar and Sunpower with higher percentages.
Plotting that in charts would have just shown a very thick slightly wavering line with two occasional spikes. Basically, not much use at all.
However, there is more variability today, so we have shown two examples of R&D expenditure as a percentage of revenue.
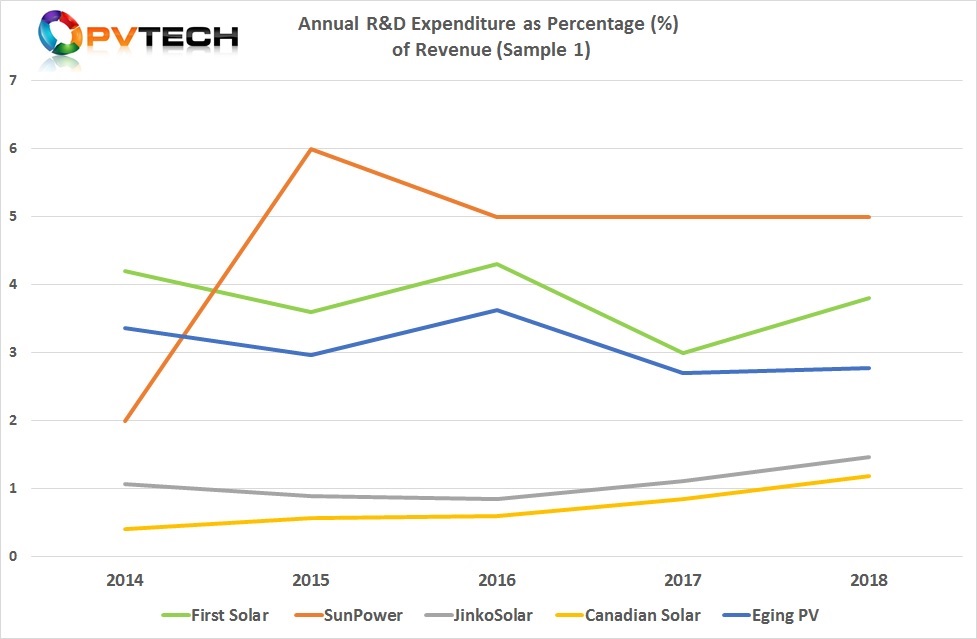
In the first sample chart, we have included First Solar and Sunpower to represent the historical high-end of R&D expenditure as a percentage of revenue as well as the inclusion of the two major SMSL’s (JinkoSolar and Canadian Solar) that had been perennial laggards in total annual R&D spending. We have also included a typical example of a relatively small PV manufacturer in the form of Eging PV.
This selection of companies is a good representation of the historical highs and lows of R&D expenditure as a percentage of revenue.
A key takeaway is that proprietary technology used by First Solar and Sunpower requires, compared to the others, much higher R&D expenditure as a percentage of revenue.
However, being laggards in total annual R&D expenditure as well as a percentage of revenue has historically had little negative impact on JinkoSolar and Canadian Solar, as both have become the largest crystalline PV module manufacturers in the world today.
In the second sample chart below, we have included three major, China-based integrated PV manufacturers, LONGi Group, TZS and GCL Group and arguably the most closely matched from a business model perspective.
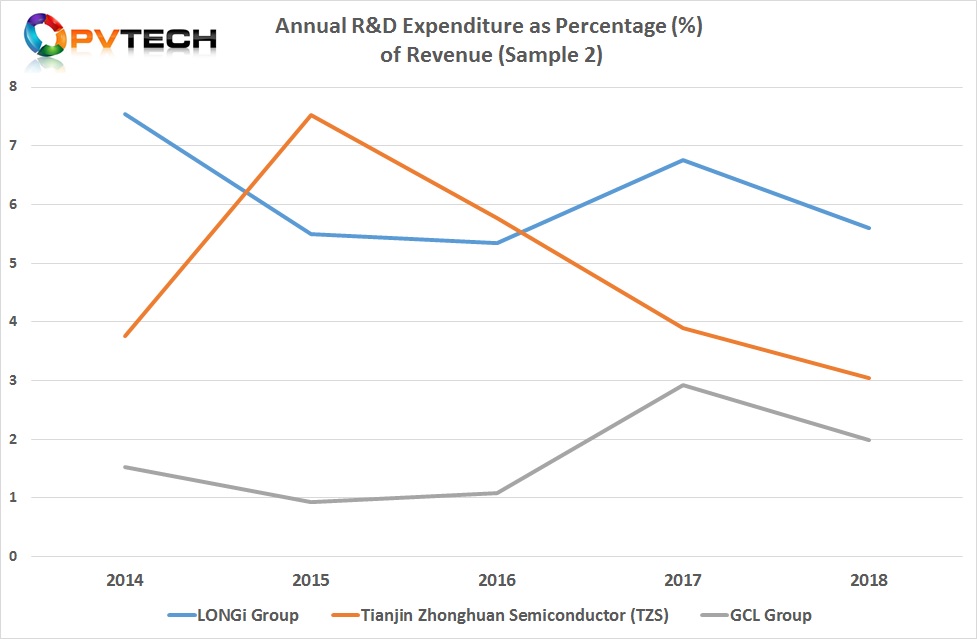
The main deviation here is that GCL Group can be deemed as the historical major incumbent and has been the largest company in the PV industry by revenue and scale in polysilicon and multicrystalline wafer capacity for many years.
LONGi Group and TZS have become fast growing companies that have strong R&D spending regimes coupled to strong revenue growth. Indeed, in 2018 both companies R&D expenditure as a percentage of revenue declined at almost the same rates but the reality was that both companies' total revenue significantly increased over the previous year, while R&D spending increased but clearly at a slower pace than revenue.
In contrast, GCL Group reported markedly lower revenue in 2018, compared to the previous year. GCL Group companies significantly cut R&D spending, year-on-year, due to financial constraints, causing R&D expenditure as a percentage of revenue to decline.
Therefore, it could be argued that emerging major players displaying high R&D spending in the last five years have gained significant market share against an historical incumbent. However, GCL has been an investor in TZS as well as SunPower, muddying the waters for a clear-cut comparison.
Despite continued upheaval in the companies being tracked and those untracked that will surely occur in 2019 as well, it remains somewhat remarkable that over US$1.0 billion was allocated in R&D expenditure in 2018.


