Nowadays, renewable energy is playing an increasingly significant role in the global context. It reduces dependence on fossil fuels and provides value in energy supply security and global warming mitigation. More importantly, the substantial cost reduction of renewable energy technologies enables the transition from subsidies to grid price parity with conventional electricity sources and actualises its market-driven expansion. According to figures produced this year by the International Renewable Energy Agency (IRENA), global renewable generation capacity increased by 257GW in 2021, with solar energy contributing to 52% of this increase. [1]
The PV industry is currently on the cusp of n-type technology evolution in pursuit of higher energy efficiency as the dominant technology, passivated emitter and rear cell (PERC) almost reaching its limited theoretical efficiency. New technologies including tunnel oxide passivated contact (TOPCon) and heterojunction (HJT) provide chances of lowering the levelised cost of energy (LCOE), even based on the fact that the price of n-type modules is currently higher than PERC. There have been a lot of studies on the LCOE of TOPCon and HJT for different purposes, however most of them are based on limited scenarios, and the boundaries may not be defined clearly. Whereas an LCOE assessment is sensitive to module performance, solar resource, system design, labour cost, etc., it is meaningful to make an LCOE analysis for PV technologies based on a variety of scenarios.
Try Premium for just $1
- Full premium access for the first month at only $1
- Converts to an annual rate after 30 days unless cancelled
- Cancel anytime during the trial period
Premium Benefits
- Expert industry analysis and interviews
- Digital access to PV Tech Power journal
- Exclusive event discounts
Or get the full Premium subscription right away
Or continue reading this article for free
Methodology
In this paper, we compare the LCOE of TOPCon and HJT with PERC in different scenarios as follows. We chose five project locations with typical climate features, irradiance levels and balance of system (BOS) cost levels. We also include a range of albedos from 10% to 30% at each location. For each scenario, the DC/ AC ratio is optimised to reach the lowest LCOE of each selected PV technology. Finally, a premium in the price of TOPCon and HJT relative to PERC is calculated for each scenario when different technologies reach the same LCOE.
Energy generation
Energy generation is simulated with the PVsyst software. The TOPCon PAN file is based on the actual performance of Chint New Energy Technology Co.’s module product – ASTRO N – meanwhile the PAN files of PERC and HJT are based on a general industry-wide performance level.
Locations
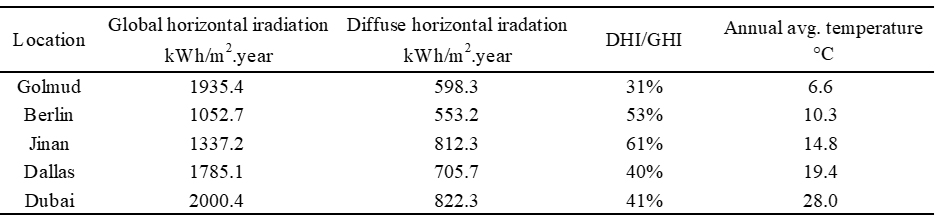
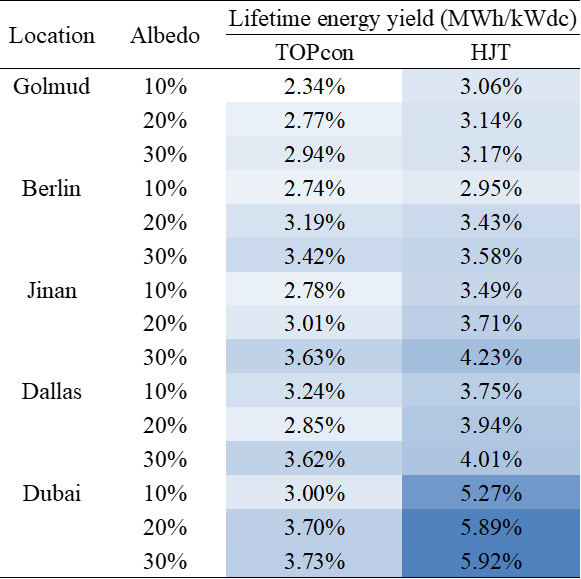
We chose five typical locations, including Golmud (China), Berlin (Germany), Jinan (China), Dallas County (US) and Dubai (UAE). Their global horizontal irradiance (GHI), diffuse horizontal irradiance (DHI) and annual average temperature are listed in table 1. The level of irradiance and the temperature have a great impact on the energy yield, and PV modules generally generate more energy with high irradiance levels and low temperatures. The ratio of DHI and GHI influences the bifacial gain of energy generation, as a high proportion of DHI means more light can be received at the rear of the module. Albedos of 10%, 20% and 30% are applied to the simulation at each location. The energy yield gain of TOPCon and HJT is calculated as a relative value to PERC.
BOS cost
Note that the BOS costs are not the same for different technologies and for different albedos, even at the same location because the DC/AC ratio will be slightly changed. The BOS cost includes module installation, tracker material and installation, DC electrical parts such as wire and combiner boxes, AC electrical parts such as inverters, wire and transformer substation, system design, permission and licensing fee and overhead. Berlin and Dallas County represent locations with relatively high BOS cost, while Dubai and Jinan/Golmud represent locations with relatively moderate and relatively low BOS cost, respectively.
LCOE
The calculation for LCOE is the net present value of the total life cycle costs of the project, divided by the net present value of energy produced over the system’s lifetime. The total life cycle costs can be disaggregated as initial investment, annual cost, depreciation tax benefit and system residual value. [2] The initial investment (US$/Wdc) is the sum of the BOS cost and the module price.
Premium
Module prices of the three PV technologies are assumed to be the same. The premium refers to the additional price of TOPCon/HJT relative to the price of PERC when they achieve the same LCOE results.
System design
Since the industry is moving towards large-format modules, we compare the 210mm wafer 132 half-cell bifacial modules of three technologies. The detailed information is listed in table 2.
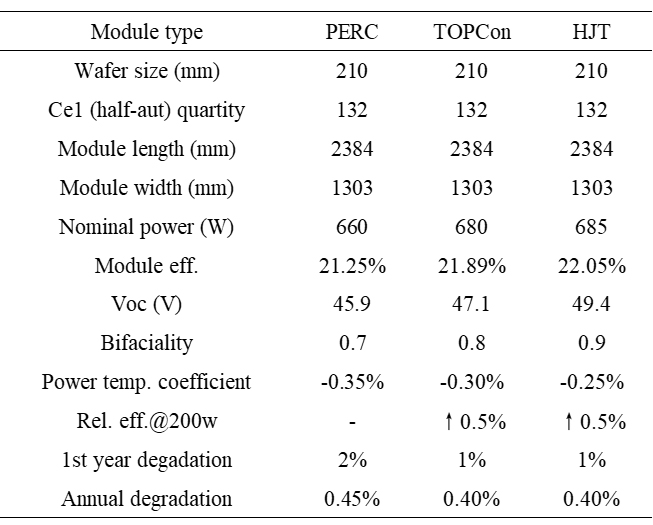
The AC capacity of the utility-scale plant is designed to be 100.8MW. The system voltage is 1500V. The number of modules per string is determined by the lowest temperature at each location. The system configuration is a horizontal single-axis tracker system, with two strings of modules on each tracker. The site area is assumed to be unlimited, the ground coverage ratio is calibrated at 33.3%, and the land cost is also considered. The system lifetime is set for 30 years.
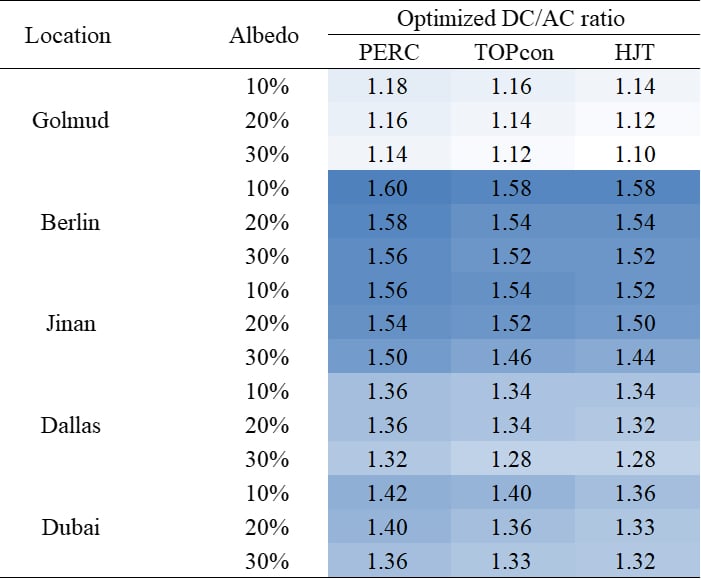
In real projects, high DC/AC ratios increase the overload energy loss in inverters at peak generation, and at the same time it decreases BOS cost. Therefore, DC/AC ratio should be optimised to balance between the two. In this study, we optimised the DC/AC ratios for each combination of PV technologies, project locations and albedo values, based on the lowest LCOE point. The optimised results are listed in table 3. It generally follows rules that the optimum DC/AC ratio in high solar resource regions, with high albedo and high energy generation performance, is lower than that for low solar resource regions with low albedo and low energy generation performance.
Results
The lifetime energy yield gain at our modelled Dubai project provides the upper limit due to n-type’s outstanding performance at high temperature. In contrast, the plateau-climate features of low temperature in Golmud result in the lower limit. Energy yield gain at the two locations with different albedos is broken down to the contributions as shown in Fig. 1. The three PV technologies exhibit different performance in energy generation due to their differences in bifacial factors, temperature coefficients and first-year degradation values which can be primarily attributed to light-induced degradation (LID). Bifacial gain is larger at locations with high albedo, and the temperature loss difference is more obvious in places with hotter climates.
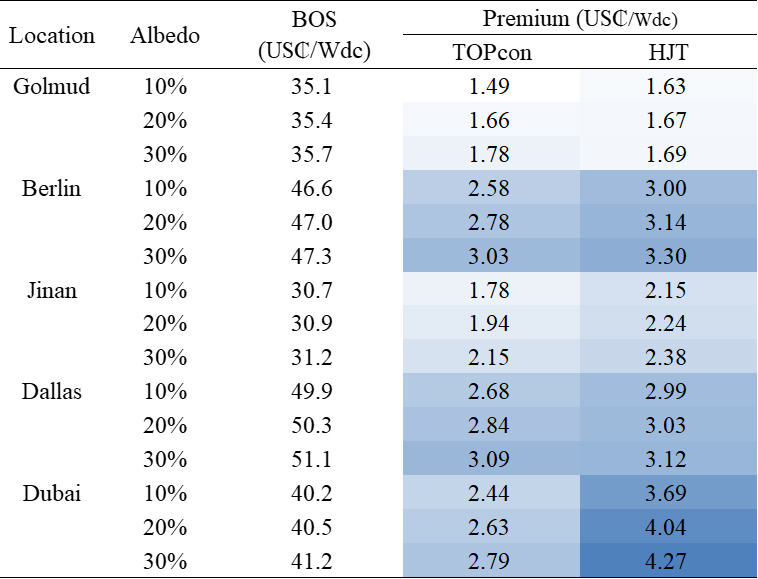
The BOS cost and premium of TOPCon and HJT relative to PERC are shown in table 5. The BOS refers to that of the PERC system at 20% albedo. It should be pointed out that the module prices of the three technologies are assumed to be the same in LCOE analysis to calculate the premium. TOPCon and HJT are more competitive with high BOS cost levels, high temperature and high ground albedo in most cases. For example, HJT in Dubai with 30% albedo results in a very high premium of US$0.043/Wdc, and this is because HJT has a low temperature coefficient which allows it to perform well at high temperatures throughout the year. On the other hand, Jinan and Berlin have similar solar resource levels and temperatures, hence similar energy yield gain, but the premium in two locations is quite different. This is mainly because Berlin has a comparatively higher BOS cost than Jinan, and this makes the energy gain in Berlin more valuable.
Furthermore, it is meaningful to compare the premium between TOPCon and HJT and provide a range of price difference in order to determine the economical priority. As shown in Fig. 5, the premium differences are within a range of 0.01 – 1.42 US$ cents per watt based on the typical albedo environment. In cold and mild regions, the premium differences are less than 0.36 US$ cents per watt.
Conclusion
Regarding energy generation, HJT is the top performer amongst the three PV module technologies, while TOPCon is the second, especially in hot and sunny regions with high albedo. This is due to their advantage of low temperature coefficient and high bifaciality.
On the other hand, high energy generation ability reduces the optimum DC/AC ratio required to reduce the inverter’s overload power loss. This is the reason for HJT systems to be designed with a smaller DC/AC ratio. As a result, reduced DC/AC ratio increases the BOS cost on the AC side. In LCOE analysis, we compromise the energy yield and the BOS cost to pursue the lowest LCOE for each technology. Therefore, the results of premium do not fully comply with the results of energy yield gain.
In LCOE analysis, the prices of the three technologies are assumed to be identical, while in real-world projects of today, the prices of TOPCon and HJT modules are ~1-2 US cents per watt and ~3 US cents per watt higher than the price of PERC, respectively. Considering the price differences, TOPCon has the highest priorities in most mild climate regions. In hot regions like Dubai, the choice between TOPCon and HJT depends more on the price.
References
- Renewable capacity highlights. (2022). [online] Available at: https://www.irena.org/-/media/Files/IRENA/Agency/Publication/2022/Apr/IRENA_-RE_Capacity_Highlights_2022.pdf?la=en&hash=6122BF5666A36BECD5AAA2050B011ECE255B3BC7.
- Campbell, Matthew. Levelized Cost of Energy for Utility-Scale Photovoltaics. Solar Cells and Their Applications, 4 Aug. 2010, pp. 251–270.
Authors
Xuanyi Shi, solutions senior engineer, Chint New Energy Technology Co. Xuanyi Shi’s areas of expertise include silicon PV cell R&D, PV system energy yield simulation and PV technology LCOE evaluation. From 2019 to 2021, she worked at the R&D center of Jinko Solar as an engineer in the cutting-edge technology project team. Since 2021, she has worked at Chint Solar, being responsible for PV module technical support and LCOE analysis.
Baohua He, global technical service senior manager, Chint New Energy Technology Co. Baohua He worked at Canadian Solar and Hanergy before joining Astronergy. His key competences and fields of activity include thin-film and crystalline silicon PV module product R&D, PV system data analysis and energy yield simulation, PV technology LCOE evaluation, and PV module performance evaluation at system level, as well as global PV module technical support work.
Shengyong Zhou, product technical service director, Chint New Energy Technology Co. Shengyong Zhou joined Astronergy in 2010 after three years working in Applied Materials, being responsible for testing laboratories, quality management, product management and technical services. His areas of expertise include R&D and characterisation of crystalline silicon and thin-film PV modules, and reliability research.
Wei Zhang, vice president, Chint New Energy Technology Co. Wei Zhang started his career in the PV industry in 2007, after working for Huawei for five years. With over ten years of experience in sales, investment, and management, he has a thorough understanding of the PV market’s development and customer demand.

")


