
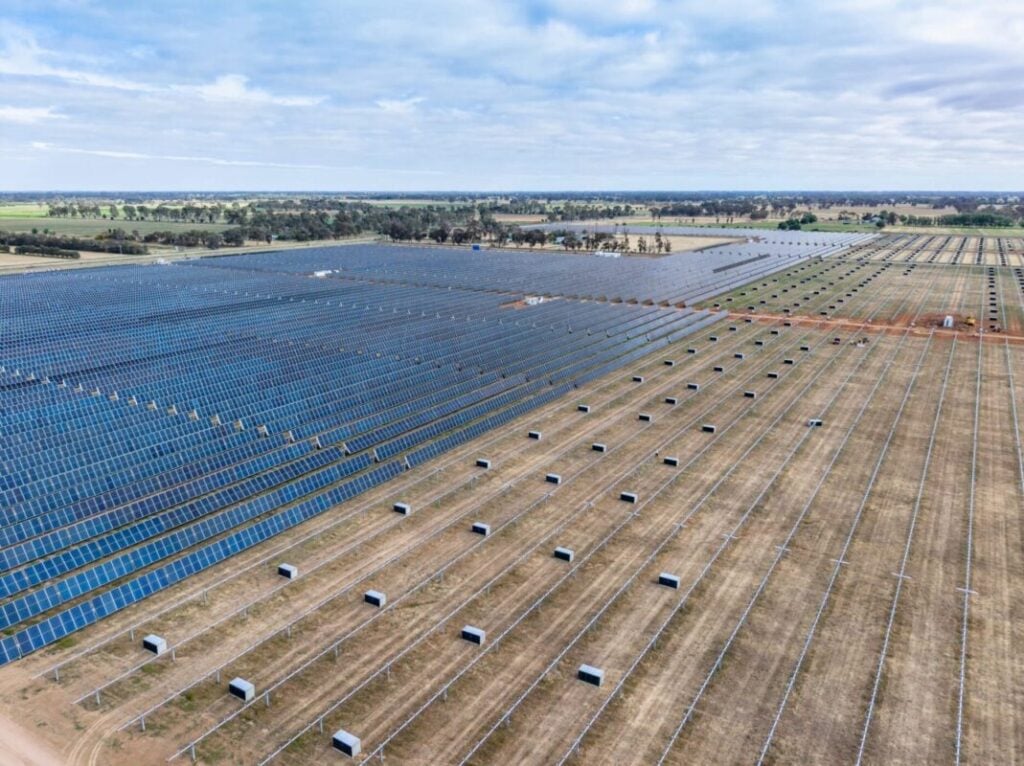
Utility-scale solar generation in Australia’s National Electricity Market (NEM) fell 3.3% to 1,746GWh in October 2026, its first monthly decline since June, as annual growth slowed to 4.4%.
Data from Open Electricity shows utility-scale solar PV plants produced 59GWh less than September’s 1,805GWh. This is despite the country moving into the peak of spring.
Try Premium for just $1
- Full premium access for the first month at only $1
- Converts to an annual rate after 30 days unless cancelled
- Cancel anytime during the trial period
Premium Benefits
- Expert industry analysis and interviews
- Digital access to PV Tech Power journal
- Exclusive event discounts
Or get the full Premium subscription right away
Or continue reading this article for free
Its 4.4% rise on October 2025’s 1,672GWh was the segment’s smallest year-on-year gain in the past 12 months, down from 36.9% in September. The segment had grown every month since July, when output rebounded from the winter trough.
Rooftop generation moved the other way, climbing 7.6% from 2,975GWh to 3,202GWh. That is its highest total since January 2026’s 3,464GWh.
Rooftop’s gain was enough to lift combined solar generation 3.5% from September’s 4,780GWh to 4,948GWh. That makes October the strongest October in the three-year dataset and the highest monthly total since January.
The combined month-on-month gain was narrower than in recent months, and well below the 19.88% rise from September to October in 2025. September output climbed 22.8% from August, which had itself risen 17.3% from July.
Year-on-year growth also slowed. Combined output was 5% above the 4,711GWh recorded in October 2025. Rooftop generation was 5.4% higher than the 3,039GWh recorded a year earlier.
Combined output has now risen for four consecutive months. It fell 58% from December 2025’s peak of 5,701GWh to 2,413GWh in June 2026, before July’s 37.4% rebound to 3,320GWh.
Over two years, the gains are wider. Combined output is 15.3% above October 2024’s 4,291GWh, with utility-scale up 20.5% and rooftop up 12.7%.
Last year’s October total was the third-best month on record when PV Tech reported the October 2025 figures, behind December 2024 and January 2025. This October ranks fifth in the dataset, behind December 2025 (5,701GWh), January 2026 (5,698GWh), December 2024 (5,213GWh) and January 2025 (5,039GWh).
Rooftop systems produced 64.7% of combined solar output in October, close to the 64.5% share a year earlier.
Late-month surge sets October’s daily highs
Daily output followed a stop-start pattern through the first three weeks before strengthening in the final week. Utility-scale solar averaged 56.3GWh a day and rooftop 103.2GWh, putting rooftop output 83% higher. A year earlier, rooftop averaged 97.4GWh against 54.4GWh for utility-scale, a 79% gap.
The opening fortnight included several strong days. Rooftop generation reached 121GWh on day 7 and 126GWh on day 11, while combined output passed 180GWh on days 4, 7, 8, 9 and 11.
Day 13 was the weakest of the month for utility-scale solar at 32GWh, with rooftop falling to 74GWh. Combined generation of 106GWh that day was the lowest October reading. Utility-scale output stayed in the 43GWh to 61GWh range through the following week.
Rooftop’s lowest reading came on day 25, at 73GWh, alongside 44GWh from utility-scale solar PV plants. Output recovered sharply the next day, with utility-scale reaching 70GWh on both days 26 and 27.
Day 29 set the month’s highs for both segments. Utility-scale solar generated 81GWh and rooftop 136GWh, giving a combined 217GWh.
Those figures are above September’s daily peaks of 75GWh for utility-scale and 122GWh for rooftop. They also compare with a best combined day of 186GWh in October 2025.
The late surge followed a similar pattern to August, when both segments built towards the month’s end, with rooftop setting four consecutive daily highs in the final days. October’s final day fell back to 48GWh for utility-scale and 85GWh for rooftop.
Mid-month spike lifts average prices
Prices rose across October after a subdued September. On a simple daily basis, utility-scale solar averaged about AU$68.23/MWh (US$48/MWh) and rooftop about AU$57.18/MWh, up from roughly AU$23.90/MWh and AU$13.90/MWh in September.
Much of that increase came from two days. On day 12, utility-scale prices averaged AU$206.71/MWh and rooftop AU$448.14/MWh, the highest readings of the month, on combined output of 160GWh. Prices stayed high on day 13 at AU$189.42/MWh and AU$136.64/MWh, as generation fell to its monthly low.
The day 12 rooftop reading was above the AU$225.88/MWh peak recorded on 18 May, when rooftop output contracted 21% over the month.
The spike came a day after the month’s only negative price. Rooftop averaged -AU$20.29/MWh on day 11, when it generated 126GWh, while utility-scale prices held at AU$18.86/MWh.
Excluding days 12 and 13, utility-scale prices averaged about AU$59.27/MWh and rooftop about AU$40.96/MWh. Both remain above September’s levels.
Negative pricing was much less frequent than in September, when rooftop recorded a negative daily average on ten days. Utility-scale prices stayed positive throughout October. In October 2025, both segments posted negative prices on nine days, with rooftop reaching -AU$27.70/MWh.
A second, smaller run of higher prices occurred from day 21 to day 24. Utility-scale prices held between AU$80.99/MWh and AU$93.85/MWh, while rooftop ranged from AU$64.33/MWh to AU$79.38/MWh. Output over those four days ranged from 47GWh to 61GWh for utility-scale, broadly in line with the monthly average.
Utility-scale prices were lowest on days 4 and 11, at AU$18.65/MWh and AU$18.86/MWh. Rooftop prices fell to AU$3.98/MWh and AU$6.92/MWh on days 17 and 18.
Rooftop solar traded below utility-scale on 29 of October’s 31 days. The two exceptions were day 5, when rooftop averaged AU$80.95/MWh against AU$80.35/MWh, and the day 12 spike.
The gap between the segments follows the pattern seen earlier in the year. In August, rooftop traded at a discount on 22 of 31 days, while July recorded no negative prices as winter heating load limited midday surpluses.
You can explore previous solar generation performance in our NEM data spotlight series, with all entries available to PV Tech Premium subscribers.