PV modules will keep changing in the quest for higher efficiency and energy yield. However, the rapid and sometimes simultaneous introduction of new technologies increases overall quality risk, writes George Touloupas, senior director at Clean Energy Associates.
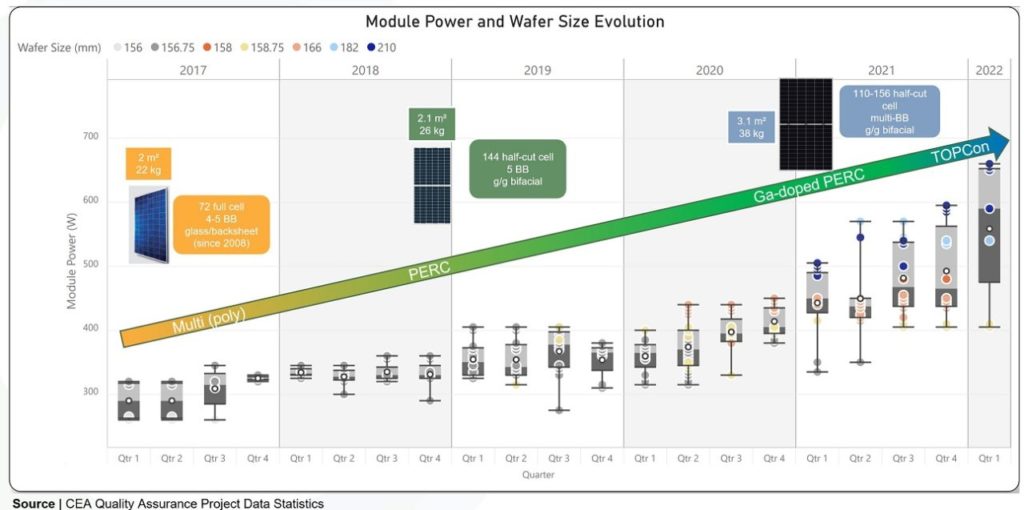
The rate of change of PV module technology has markedly accelerated in the last four to five years, bringing new challenges for performance and quality. Chart 1 is based on CEA’s Quality Assurance data going back to 2017, when the most common utility-scale product still was a 72 full six-inch cell, multi-technology, glass-backsheet PV module, which was first launched back in 2008.
Try Premium for just $1
- Full premium access for the first month at only $1
- Converts to an annual rate after 30 days unless cancelled
- Cancel anytime during the trial period
Premium Benefits
- Expert industry analysis and interviews
- Digital access to PV Tech Power journal
- Exclusive event discounts
Or get the full Premium subscription right away
Or continue reading this article for free
In the last five years we have witnessed the transition from multi crystalline Al BSF cell technology to mono PERC, the wide adoption of half-cut cells, the dominance of bifacial glass-glass products, the introduction of multiple busbars (wires), the shift towards large format wafers (166mm and then 182mm and 210mm), the introduction of gallium doped p-type wafers and recently the rise of n-type cell technologies, and predominantly n-TOPCon.
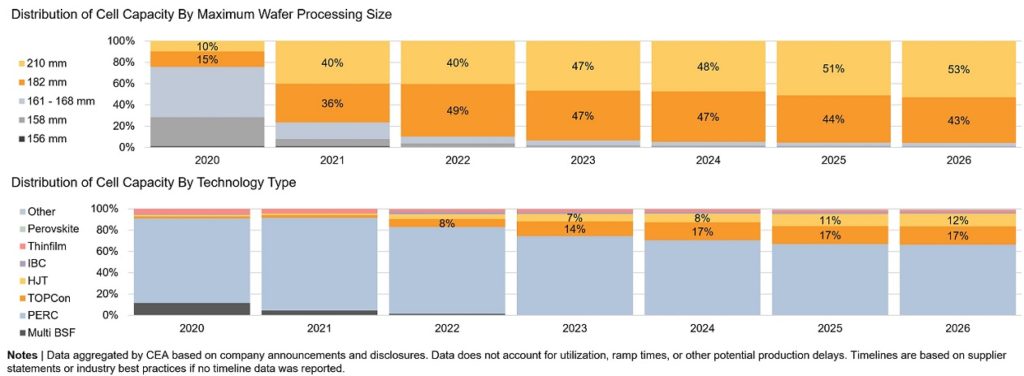
Looking at chart 2, we observe that 210mm and 182mm formats have split shares globally. However, 210mm lines can produce 182mm cells and most 182mm lines are “future proofed” to quickly convert to 210mm, if needed, so the split between 210mm and 182mm is quite flexible.
“Exotic” formats such as 218mm are unlikely to prevail, however we have recently seen 182mm variants being introduced, e.g., with 182mm (width) x 185mm (height), to minimise the white space between cells in the long direction of the module. Trina recently launched a 210mm variant, with 182mm (width) x 210mm (height) to offer products following the 182mm product group module width. As all these variants rely on either the M10 or G12 ingot platforms, we do not make a distinction in our forecasts.
Although n-type expansions appear limited, suppliers can accelerate the pace once the technology and cost hurdles are surpassed. TOPCon is especially favoured, as most existing PERC capacity can be upgraded to TOPCON.
Several large suppliers have formed 182mm or 210mm cell alliances to standardise module dimensions and reduce component and balance of system (BOS) costs. Suppliers of PV components like glass, inverters, trackers and others have become a part of these alliances, which will further unify component supply chains and reduce risk of supply chain bottlenecks.
Because TOPCon shares much of the same equipment and infrastructure as PERC, no changes in module form factors are expected when TOPCon surpasses PERC in availability. Similarly, HJT products already exist that have adopted standardised dimensions.
Impact on PV module quality
The rapid and sometimes simultaneous introduction of new technologies increased overall quality risk. CEA’s quality assurance teams collect masses of datapoints during factory inspections: findings and defects of various severities and frequencies. The high bars in chart 3 of CEA’s Pre-Shipment Inspection data, focusing on just five major PV module suppliers from 2018 to 2022, signify higher risk. It is obvious that, although there are ups and downs, the overall quality risk score has gone up.
CEA’s data show that cracks, weak soldering and misalignment are the main factors that may cause “spikes” in risk scores for some projects, resulting in an increased number of batch rejections and rework rate. Suppliers have a hard time optimising and troubleshooting their new or upgraded lines and adapting to the new technologies. Hands-on quality assurance has always been a must for PV modules, and the need is even more pressing now.
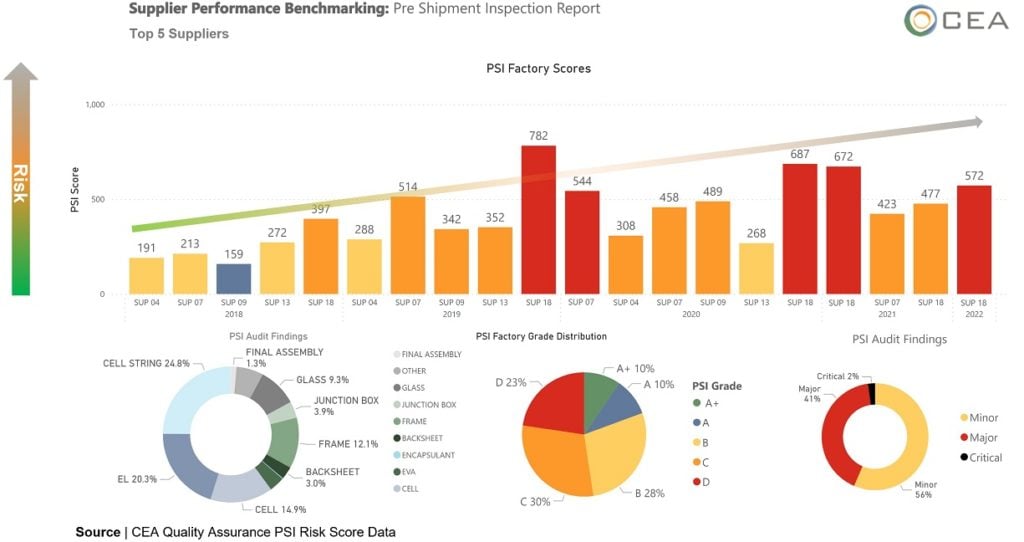
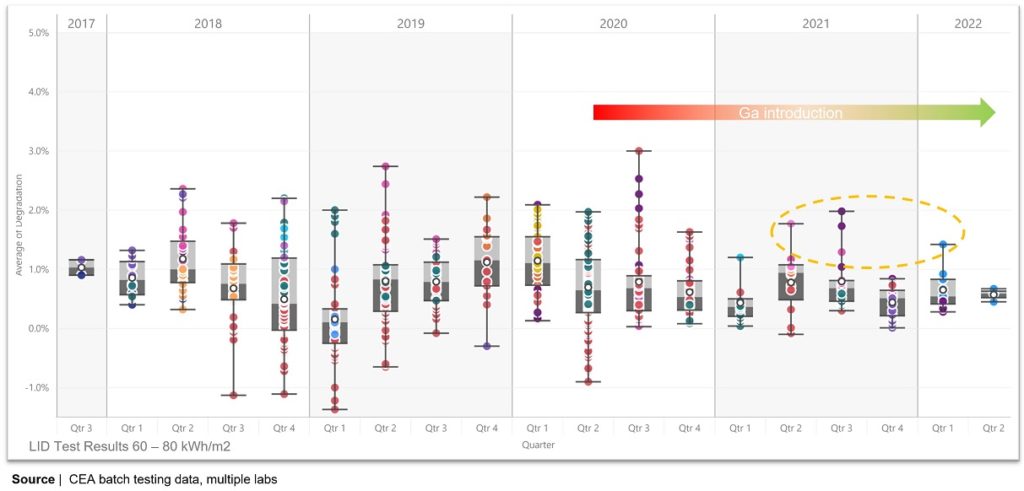
Chart 4 shows testing data from CEA’s QA batch testing programme, from various projects since 2019. Looking at LID performance, the introduction of gallium doped wafers has improved LID, with Q1 2022 LID average value being close to 0.40%. However, we can still find outliers, possibly because the transition to gallium from boron has not been uniform across the industry. Regarding LETID, we have seen that LETID control has improved, but, occasionally, we do see outliers.
The mainstream module design is using half-cut cells and multiple wire ribbons, sometimes with reduced distance between cells. Although microcracks are controlled at the factory, at least when robust quality assurance is in place, we have noticed a spike in a new type of edge ribbon crack in field inspections. This is a particularly insidious type of crack that can develop into tree cracks after installation and operation. It is important to have good quality assurance protocols during production and onsite, and contractual provisions to mitigate this risk.
Half-cut module production requires that the cells be cut in half to form the half-cut cells. The cutting process risks damage to the edge of the cell that can create initiation points for cell microcracks, with the most common location for cracks to form on the cut edge being under the wire ribbon. This risk is enhanced by module designs with dense interconnection (paving, tiling) and cutting methods that reduce the mechanical strength of the silicon wafer. Edge cracks are often very small initially and therefore challenging to detect during factory quality control, even if they are present before the module leaves the factory.
Edge cracks can also develop during transportation from highly stressed centres (seed cracks) that initiate the crack formation with the movement and vibration of the modules. Even when cracks are present and detectable many manufacturers allow for a minimum crack length in their factory EL criteria. As a result, the small edge cracks can be considered acceptable regardless of quantity. Once formed, the cracks have the potential to grow during shipment, installation and operation.
LCOE and price premium
LCOE is a very important KPI in selecting the components and design parameters of a PV plant. Bifacial TOPCon modules, although currently more expensive than PERC, have the potential to achieve lower LCOE than PERC modules because of reduced BOS cost due to higher efficiency, as well as higher energy yield, due to higher bifaciality, lower temperature losses and lower first-year degradation.
To understand the impact of high efficiency, advanced technology modules on LCOE, we studied a 100MWdc PV system, located in Spain, using single axis horizontal trackers. For our comparison, we selected two PV module products with the same construction, 78 cells, half-cut, bifacial modules, one with PERC cells and one with TOPCon cells. Several assumptions for BOS components cost for the baseline PERC system were informed from several sources (Fraunhofer ISE, supplier data) and the module cost and price data points were taken from CEA’s PV Price Forecasting Tool and price tracking. PV Syst was used to derive the respective energy yields.
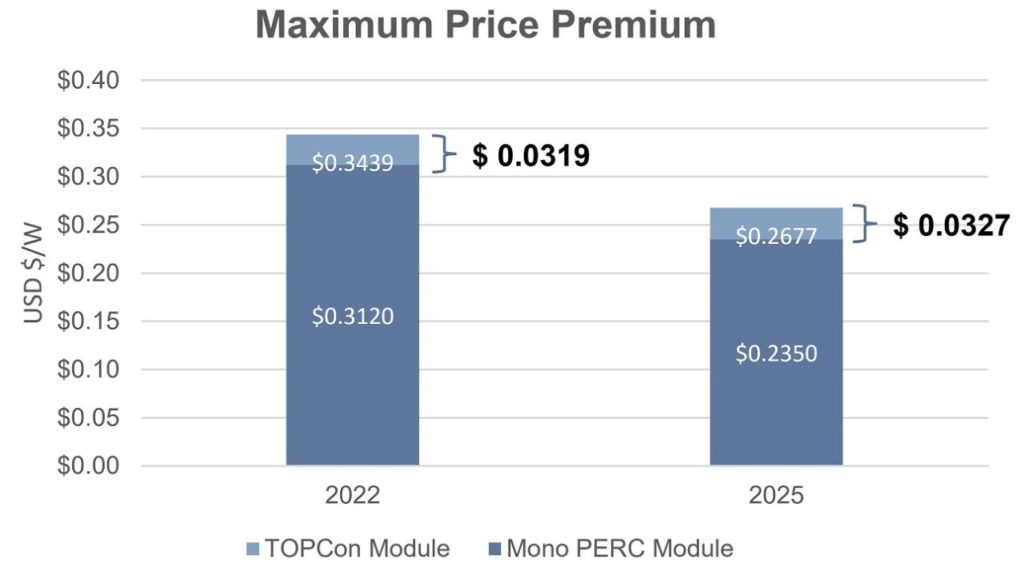
To perform our analysis, we defined a useful new metric, the “maximum price premium” which is the price premium of a high efficiency PV module, TOPCon in this case, that could be commanded with respect to a PERC PV module baseline price, if the goal is to achieve 0% LCOE advantage. In our analysis, we equalised the LCOE for PERC and TOPCon systems, by deriving the TOPCon module price, via adding the maximum price premium to the PERC module base price.
In chart 5, we calculated a maximum price premium of TOPCon is US$0.0319/W in 2022 and forecasted it to be even higher, at US$0.0327/W in 2025, due to the expected increased efficiency advantage of TOPCon to PERC.
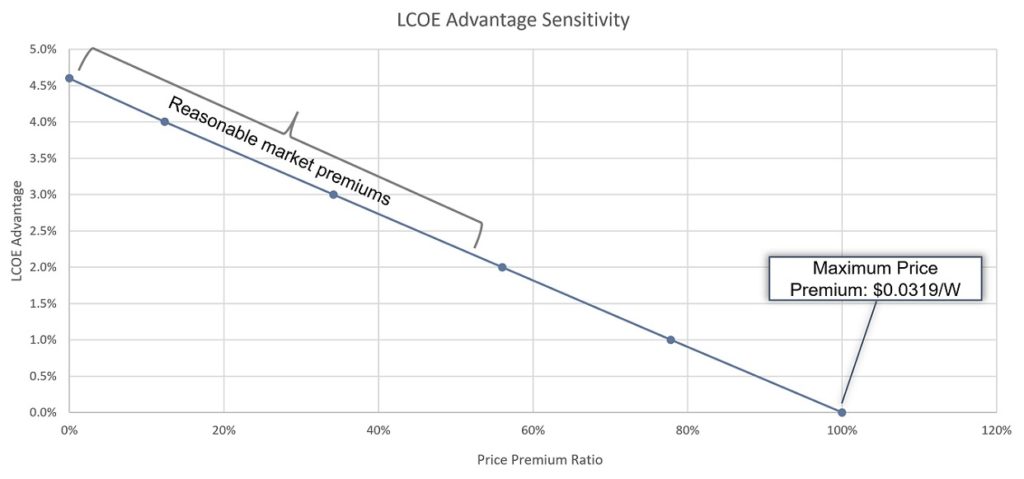
Naturally, it doesn’t make sense for a buyer to pay the maximum price premium and gain 0% LCOE advantage. However, it does make sense to pay a fraction of the maximum price premium to reduce the LCOE. Chart 6 shows the sensitivity of the LCOE advantage to the price premium, with premiums ranging below 50% of the maximum resulting in LCOE advantages of 2.5% or higher.
The maximum price premium is sensitive to three main factors:
- Efficiency advantage, that affects the BOS capex.
- Specific energy yield advantage, that in turn depends mainly on bifaciality, power temperature coefficient and affects the cashflow.
- First- and subsequent-year degradation in the module warranty, that affect the cashflow.
By varying these parameters individually with respect to the base case, we estimated their effect on price premium, with some interesting results:
- Even if the specific energy yield advantage is reduced to 0%, the maximum price premium is still 60% of the base case, because of the BOS capex savings.
- Increasing the efficiency advantage from 3.7% (base case) to 8% increases the price premium by 28%.
- Increasing the first-year degradation from 1% to 2% results in a price premium reduction of 23% and increasing the annual degradation from 0.40% to 0.45% results in a reduction of 11%.
Conclusions
PV modules will keep changing in the quest for higher efficiency and higher energy yield, leading to lower LCOE. However, technology forecasts remain risky, especially regarding the timelines, because moving beyond tipping points accelerates change. Finally, the introduction of new technologies, new production methods at new facilities (perennial ramping up) create new risks, which must be continuously investigated and assessed. Sustainability will be an important future KPI, but LCOE is currently the most significant driver in technology selection. New technologies invariably offer advantages related to efficiency, energy yield and degradation and durability, all leading to lower LCOE. However, due to the complex interaction of multiple parameters affecting the LCOE, suppliers’ claims to higher performance and lower LCOE must be carefully assessed and verified.
Author
George Touloupas has been a senior director at CEA since 2015, with 12+ years of experience in technical consultancy, manufacturing, project development and EPC. George is leading CEA’s technology, quality and intelligence teams for PV, energy storage and hydrogen. Prior to this, he was the COO/CTO at Philadelphia Solar, technical operations director at Recom and founder of an EPC firm in Greece.

")


