Solar module underperformance has nearly doubled since 2019, accounting for around US$2.5 billion in projected losses for the global solar industry.
Research released from Raptor Maps – a US provider of solar lifecycle management software – showed that in 2022 the amount of power loss in solar PV modules due to anomalies was 3.13%, up from 1.61% in 2019. The research tested 24GW worth of solar modules and recorded revenue losses of roughly US$82 million, or US$3,350 per MW on average. When scaled up, this projects a US$2.5 billion revenue loss across the entire industry.
Unlock unlimited access for 12 whole months of distinctive global analysis
Photovoltaics International is now included.
- Regular insight and analysis of the industry’s biggest developments
- In-depth interviews with the industry’s leading figures
- Unlimited digital access to the PV Tech Power journal catalogue
- Unlimited digital access to the Photovoltaics International journal catalogue
- Access to more than 1,000 technical papers
- Discounts on Solar Media’s portfolio of events, in-person and virtual
The dramatic increase in underperformance casts an ominous shadow when considered alongside the vast global expansion of the PV industry. Legislation like the Inflation Reduction Act (IRA) in the US, which opened up US$369 billion for clean energy investments and the REPowerEU scheme, which is targeting 320GW of new solar by 2025, will see vast numbers of panels deployed. Raptor said that effectively the financial and generation losses will only compound as the industry expands its footprint.
“Raptor Maps now has data on 80GW of PV systems from thousands of individual inspections in dozens of countries, and the numbers tell us that power loss from anomalies has nearly doubled in four years,” said Eddie Obropta, CTO and co-founder of Raptor Maps. “The implications for the industry’s long-term bankability run deep at a time when legislation like the Inflation Reduction Act is supercharging growth in solar.”
On a system-wide level, the majority of financial loss is caused by string, inverter and combiner issues – 77% in total between the three components.
In terms of cell technologies, monocrystalline modules reported 41% fewer anomalies than thin film and 61% fewer than polycrystalline cell-based modules. Thin film modules were significantly more likely to have physical defects like cracks, whilst polycrystalline saw far more issues at a cell level.
Cell anomalies increase by 20-30% from year one to year two of operation, and after five years Raptor reported that cell anomalies increase by 495%.
The US saw above-average power loss across the modules that Raptor tested; 3.45% compared with the global 3.13% average. The least severe loss was seen in the Southeast of the country, though this was the region with the most physical anomalies – cracking, warping, delamination etc. – due to its exposure to extreme weather events. The worst underperformance was in the Pacific West and the west coast. This highlights the role locality plays in module performance, Raptor said, and the variance of asset security for concerned parties depending on region.
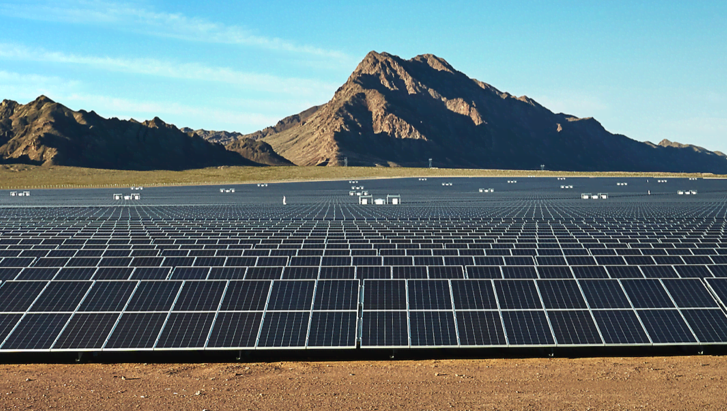
The largest PV sites often saw the worst underperformance. Projects over 200MW saw an average of 4.04% power loss, 29% higher than the global average. That constitutes an average of US$4,320 per MW lost. Smaller sites saw a higher variance in power loss and often a greater proportion of lost power compare with their size, but the scale of large installations causes greater concern. The losses on large-scale, sprawling sites highlight the need for “sophisticated geospacial intelligence”, Raptor Maps said, through digital twins of sites that allow precise pinpointing of anomalies and errors.
In December, PV Tech Premium published an in-depth analysis of the use of AI to optimise PV sites.


