Technological and financial advances in the PV industry demand greater precision in PV simulations, but the datasets used for modelling often lack the necessary sophistication. Marcel Suri, CEO of Solargis, explores three areas where new standards could help underpin greater efficiency, accuracy and market resilience.
In recent years, the solar industry has gone through a significant technological and financial shift. The development of advanced technologies such as bifacial modules, intelligent trackers and battery storage systems has ushered in a new global era of solar market innovation.
Try Premium for just $1
- Full premium access for the first month at only $1
- Converts to an annual rate after 30 days unless cancelled
- Cancel anytime during the trial period
Premium Benefits
- Expert industry analysis and interviews
- Digital access to PV Tech Power journal
- Exclusive event discounts
Or get the full Premium subscription right away
Or continue reading this article for free
Modern solar projects are more complex, and new technologies require a deeper understanding of data and system performance to yield desired results. On the business side, market-driven financial models demand higher-precision PV simulations.
While simple empirical models and low-resolution datasets have been sufficient in the past, today, reliance on these outdated approaches has resulted in inaccurate PV design and simulations, jeopardising the financial viability of projects around the world.
To handle the real-world complexities of modern solar projects, the solar industry must embrace newer, data-driven and verifiable methodologies underpinned by high-resolution data and physical-based models.
This article explores three critical areas where new industry standards must be achieved to support innovation and underpin greater efficiency, accuracy and market resilience.
#1: New data standards to account for increasing extreme weather and variability
As the current industry standard, the majority of PV project developers still rely on Typical Meteorological Year (TMY) data for PV simulations and system design optimisation. TMY aggregates data from historical years into a ‘typical’ year, reliably representing average patterns of solar radiation, air temperature and (to some extent) wind speed. However, TMY fails to account for extreme weather events and the three critical types of variability: short-term (intra-hourly), interannual (seasonal) and long-term cycles, including climate change.
Instead, TMY datasets used in the industry typically come with an hourly time resolution, and their low granularity can result in inaccurate performance estimates. While TMY data may still be useful for quick calculations during the pre-feasibility phase of projects, its limitations become increasingly evident during advanced evaluations.
High-resolution Time Series data should be adopted as the new standard for understanding short-term, interannual and long-term variability.
Short-term variability refers to rapid changes in solar radiation and environmental conditions that occur within minutes or hours, such as passing clouds, flash floods, or strong winds. When tackling short-term variability, data granularity matters most. Low-resolution hourly TMY data smooths out weather fluctuations, failing to capture the granularity required for accurate modelling.
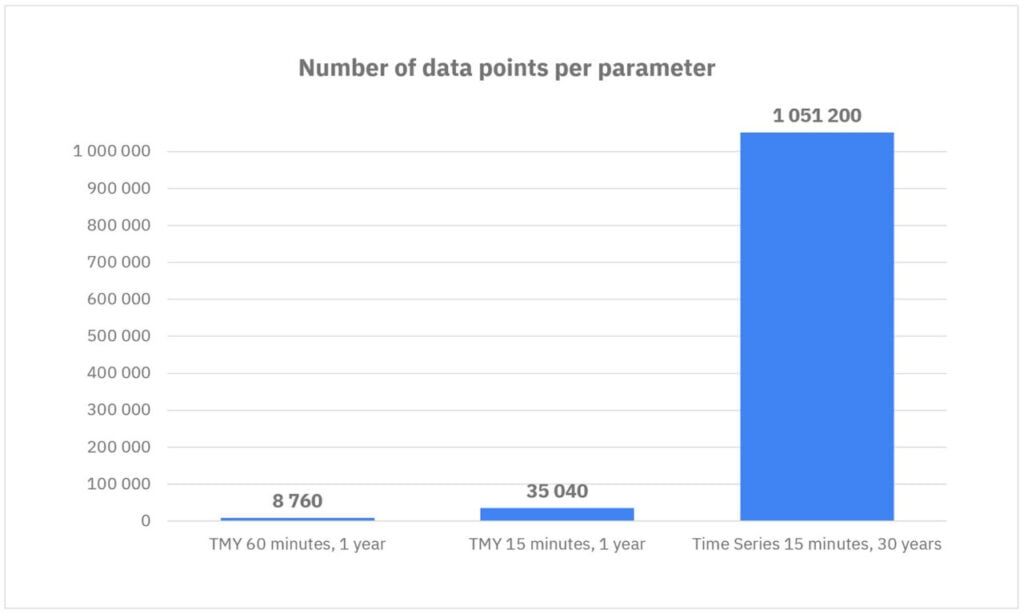
Contrary to TMY, high-resolution, 15-minute Time Series data breaks down each year into 15-minute intervals, spanning up to 30 years of history. Time Series data therefore provides an unprecedented amount of data: over 1 million data points per parameter compared to the 8,760 data points typically used in the hourly TMY-based models (Figure 1).
High cloud cover and atmospheric pollution containing aerosols impact solar power plants’ ability to generate the expected amount of energy. Extreme winds, rain, hail, and hurricanes also significantly disrupt the operation and delivery of solar power.
When these events occur, simulations done with low-granularity TMY datasets often yield overly optimistic predictions and sub-optimal system designs, because they do not allow us to anticipate and plan for “non-typical” weather scenarios. By failing to capture the full range of potential variability and extremes, developers that use TMY datasets often end up with a skewed picture of expected performance, jeopardising their project’s financial viability.
By moving from TMY-based models to high-resolution Time Series data, PV project developers can ensure more accurate PV design, performance evaluations, and, therefore, bankable and resilient projects in an increasingly unpredictable climate landscape.
Interannual variability
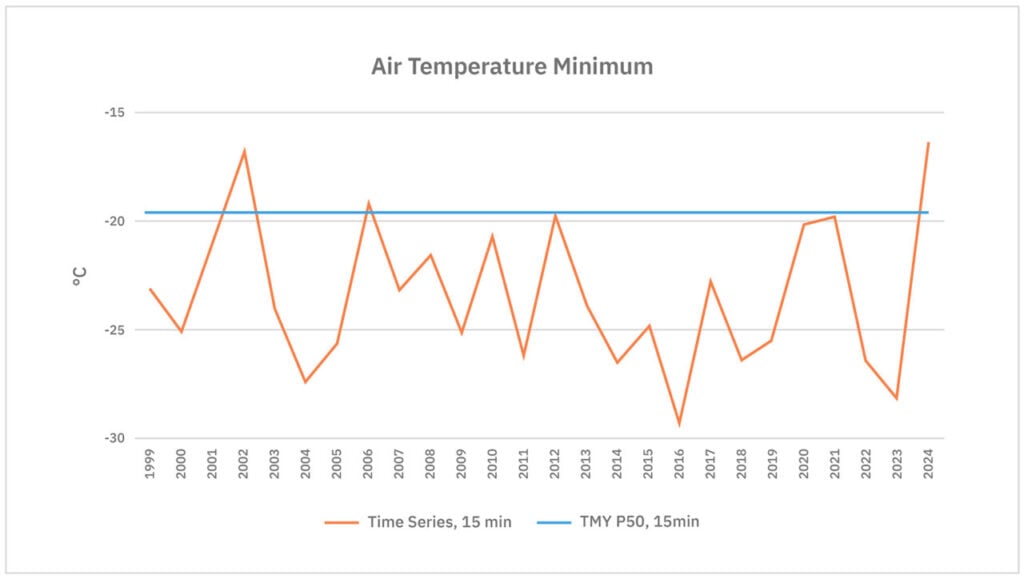
Interannual variability refers to changes in solar irradiance patterns from year to year due to natural atmospheric and hydrological cycles. The long-term averaging approach currently used, i.e., employing TMY datasets, hides critical extremes, such as unusually low or high solar radiation or temperature, leaving developers unprepared for the full range of potential conditions.
Conversely, high-resolution time series data enables year-by-year comparisons at 15-minute intervals, offering unparalleled insights into seasonal and interannual changes. Having access to year-on-year comparisons of detailed time intervals and understanding these patterns is crucial for designing systems that can deal with revenue fluctuations in regions where year-on-year variability is high. The ability to evaluate minima and maxima, rather than relying solely on averages, allows for more robust risk assessments and better alignment with investor expectations.
Long-term trends and climate change
Most variability is driven by natural processes, including long-term cycles, yet climate change introduces trends that affect baseline conditions. Rising temperatures, shifting precipitation patterns and changes in solar radiation are just a few of the ways climate change is impacting the solar energy landscape.
To understand these trends, experts must analyse a comprehensive history of solar and meteorological data – ideally spanning as long a period as possible. Relying solely on data from recent years can lead to misleading conclusions. For instance, a short-term dataset may over-represent a specific weather pattern, skewing long-term projections. By examining decades of high-resolution data, developers can distinguish between variability caused by natural cycles (e.g., El Niño) and trends possibly driven by climate change.
The impacts of climate change also vary by region. For instance, while some areas may see an increase in solar radiation due to reduced cloud cover, others may experience declines due to higher aerosol concentrations. High-quality, validated data ensures that these subtle trends are accurately captured.
#2: The solar market needs to shift to new modelling standards to
fully utilise bifacial systems
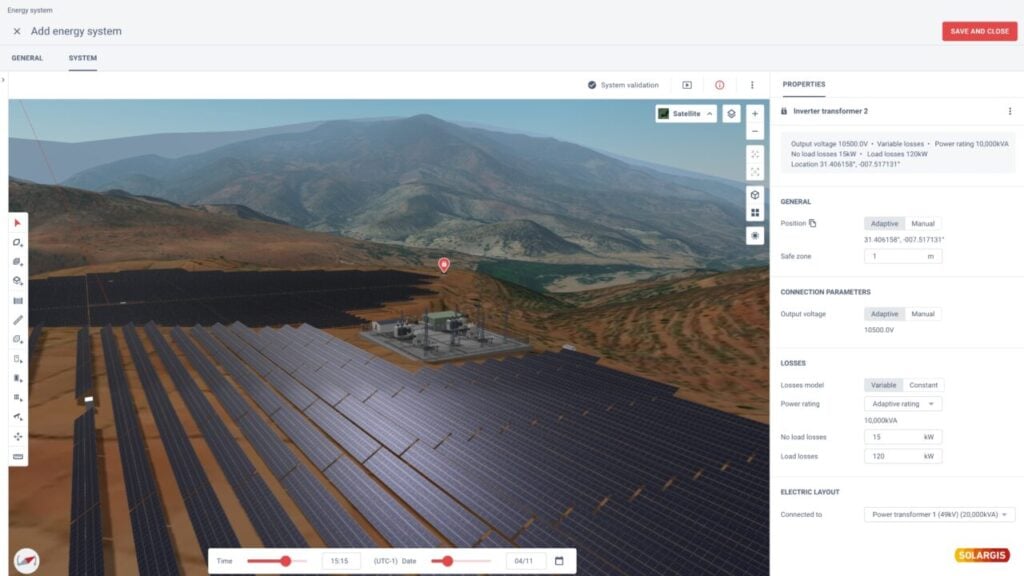
Bifacial PV modules, which capture sunlight on both sides of the cells, have become a preferred choice in solar projects due to their higher energy yields and reduced prices. Realising the full potential of bifacial technology requires a shift from traditional modelling standards to physical-based tools that accurately simulate their performance and offer better insights needed for bifacial system optimisation.
The shortcomings of the view factor and isotropic sky models
Most PV simulation tools rely on the simplified view factor model, which is based on the isotropic sky model. While suitable for monofacial systems, this approach struggles to simulate rear-side solar radiation for bifacial modules accurately. The isotropic model assumes that diffuse sky radiation is uniform across the sky dome, ignoring the complexities of reflections and shading from nearby objects such as structures, trees and other PV modules. As a result, the simulations often produce inaccurate energy yield estimates, leading to sub-optimal system designs and risks of under-performance.
The reliance on outdated model ling standards becomes increasingly problematic in designs optimised for maximised performance and cost efficiency. Developers risk overestimating PV performance and often fail to optimise system configurations for real-world conditions while using these outdated standards.
This may lead investors and stakeholders to lose confidence in projects that fail to meet performance expectations due to inaccurate simulations. To fully realise the benefits of bifacial technology, the industry must adopt new standards that rely on physically based models that account for the nuances of bifacial system behaviour.
Ray tracing and anisotropic sky models as the new standard for bifacial PV technology
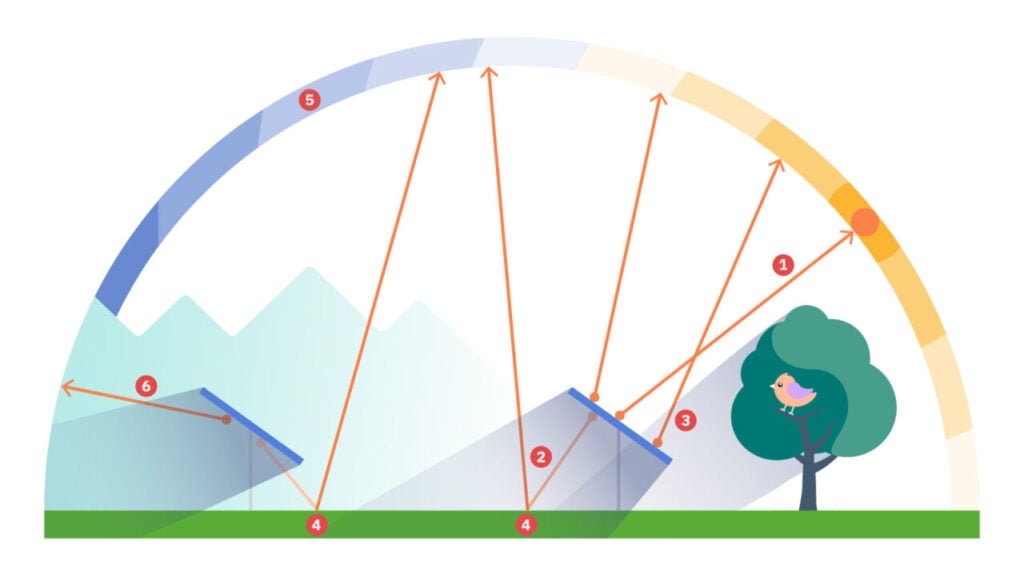
Ray tracing technology, combined with the anisotropic sky model, addresses these limitations. Unlike the isotropic model, the anisotropic sky model captures the dynamic behaviour of the sky dome and surrounding surfaces, offering a more realistic simulation of reflected light interactions with bifacial
modules. By simulating individual rays of sunlight travelling through a 3D environment, these advanced models account for shading, terrain variations and real-world conditions (Figure 3).
Additionally, using accurate site-specific ground albedo data and sub-hourly time series data enables the capture of short-term variations in both front and rear-side radiation throughout the day, providing developers with nuanced insights into energy yields. Cloud computing facilitates resource-intensive simulations by effectively managing any complexity of PV designs without compromising accurate calculations.
By adopting newer, accurate modelling standards and advanced computation techniques, developers can design bifacial systems that meet performance expectations and deliver reliable financial returns, ensuring that bifacial technology truly lives up to its potential.
#3: Outdated component data standards are skewing simulations
The outdated approaches, lack of standardisation and lack of verification of technical specifications of PV components are persistent challenges in the industry today. These issues affect not only the accuracy of simulations but also the overall success and bankability of solar projects.
New industry standards to manage data and PV component databases
PV module specifications are typically stored in PAN files, while inverter specifications are stored in OND files. The technical specifications provided in these files are not sufficient for the state-of-the-art energy simulation software solutions. The way in which these data are accessed, used and distributed results in confusion, inefficiencies and inevitable disputes. In addition, these plain text files can be easily modified and shared in an uncontrolled way, often resulting in:
- inconsistencies: multiple versions of technical specifications for the same product lead to confusion
- errors: unverified data skews energy yield estimates, resulting in flawed designs and financial risks
- overly optimistic projections: inaccurate or manipulated data often leads to simulations that fail to reflect real-world performance
Relying on unverified data extends beyond inaccurate simulations. Developers risk designing systems that underperform, leading to financial losses and damaged credibility. For investors, the lack of reliable data increases the perceived risk of projects, potentially deterring funding or leading to unfavourable terms.
The need for a verified, standardised PV component database
Access to a reliable component database ensures that PV simulations deliver accurate performance estimates, reducing risks and enhancing trust and project bankability. It also supports the broader goal of standardisation of procedures and documents used in due diligence to reduce the time and costs of delivery. The implementation of verified databases, such as the PV component catalogue, will transform how the industry approaches project design and bankability, offering greater transparency and reliability. Such verified database should:
- include validated specifications for PV modules, inverters and other PV components, considering the needs of modern physically based PV energy simulation approaches
- assign a component confidence class, indicating the reliability of the data based on automated checks, supplied critical documents, and expert validation
- simplify the work of developers, investors and auditors by providing a trusted source of information
Author
Marcel Suri is an entrepreneur and cofounder of the solar data and software company Solargis. He is an expert in solar resource, photovoltaics and geoscience. Holding a PhD in geography and geoinformatics, Marcel has made significant contributions to solar energy through science and peer-reviewed research. Driven by a passion for innovation, Marcel is dedicated to improving the efficiency of digital tools and data resources and analytics that mitigate weather-related risks and elevate industry standards.


