Slovakian firm Solargis has released its latest figures for solar irradiance in India, and reports that increasing levels of aerosols in the air have contributed to a decline in solar power output.
The data tracking company reported that January 2024 saw the poorest air quality “in decades”, with International Energy Agency (IEA) figures showing that India’s annual carbon emissions increased by 190 million tonnes between 2022 and 2023. Cloud cover generated by greater emissions helped to minimise the country’s Global Horizontal Irradiance (GHI), a measure of the amount of sunlight falling onto flat ground, which can function as a measure of the efficiency of solar panels.
Try Premium for just $1
- Full premium access for the first month at only $1
- Converts to an annual rate after 30 days unless cancelled
- Cancel anytime during the trial period
Premium Benefits
- Expert industry analysis and interviews
- Digital access to PV Tech Power journal
- Exclusive event discounts
Or get the full Premium subscription right away
Or continue reading this article for free
According to Solargis, India’s GHI was 30-50% lower across the country in the first month of the year than historical averages. The images below demonstrate the changes in GHI versus historical averages, in January of 2022, 2023 and 2024, with this year clearly showing the greatest decline.
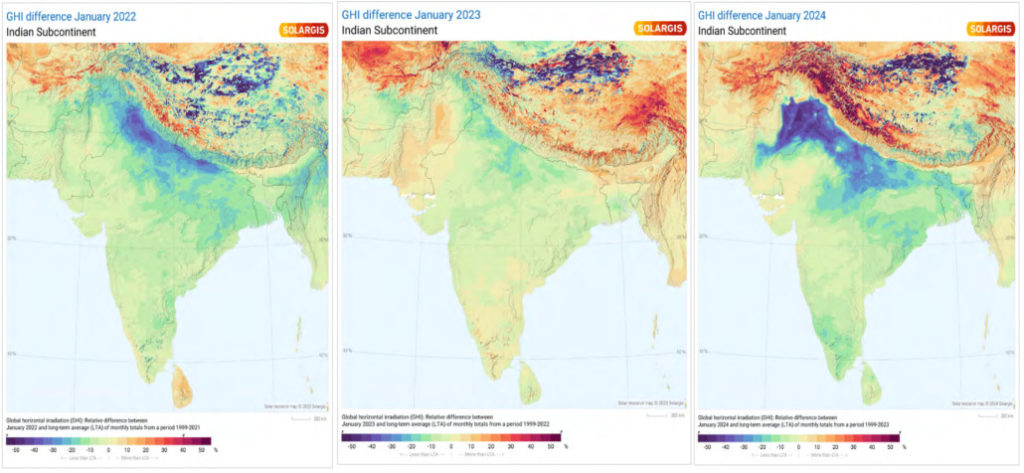
Perhaps most striking is that India’s northern states are the most affected by this decline in relative GHI, and these states are among the biggest contributors to India’s solar sector. While Rajasthan, which boasted 18.8GW of installed capacity at the end of 2023, is not affected by the sweep of lower-than-average GHI figures, the Solargis maps show the blue areas of low figures pushing into the central state of Madhya Pradesh, which has 3.2GW of installed capacity.
“January 2024 saw records broken for both the lowest average monthly temperature and lowest GHI,” said Solargis business account manager Avik Mitra. “This had tangible impacts on the financial performance of solar projects across Punjab, Haryana and Uttar Pradesh, which collectively host around 5GW of installed capacity. But this has not been an isolated event.”
More positively, some of India’s southern states reported GHI figures at least in line with historical averages, with Karnataka, in the south-west, boasting a considerable solar sector, with 9.4GW of installed capacity. Solargis noted that south-east India saw a 5% increase over its long-term GHI average in 2023, demonstrating that the climatic shifts have not been entirely harmful for the Indian solar sector.
In response to these changing environmental conditions, Solargis notes that the Indian solar sector has become more nuanced, with tenders now offered for projects that include both solar and other forms of power generation or storage. Earlier this year, Avaada and the Gujarat government signed a deal to develop a 6GW combined solar-plus-wind portfolio in the state, and the use of a range of power generation technologies could be vital in ensuring grid resiliency if GHI continues to fall below historic averages.
“There is an increasing need for Indian operators to move beyond hourly Typical Meteorological Year (TMY) data and towards higher resolution sub-hourly time series for more reliable performance evaluation,” added Mitra, highlighting the importance of more sophisticated data collection and analysis in this environment.
“This allows analysis of solar power production in extreme weather, like severe fog and smog, and enhances understanding of PV plant behaviour.”


