The impact of solar resource variability on several key global PV markets including India, Australia and North America has been revealed by a decade of analysis from solar irradiance consultancy Solargis that illustrates “significant deviations from long-term averages”.
Solargis’ 10-year Solar Performance Maps show how significant variation both above and below long-term averages has occurred across North America, India and Australia, underscoring the variability challenge solar faces.
Try Premium for just $1
- Full premium access for the first month at only $1
- Converts to an annual rate after 30 days unless cancelled
- Cancel anytime during the trial period
Premium Benefits
- Expert industry analysis and interviews
- Digital access to PV Tech Power journal
- Exclusive event discounts
Or get the full Premium subscription right away
Or continue reading this article for free
“As margins tighten for solar asset owners and investors, investment in high-quality data is crucial to understanding – and managing – the impacts of this variability on performance and profitability,” said Solargis.
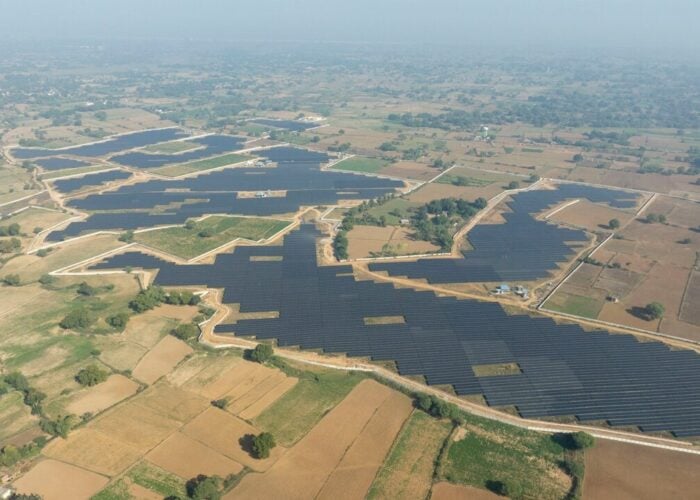
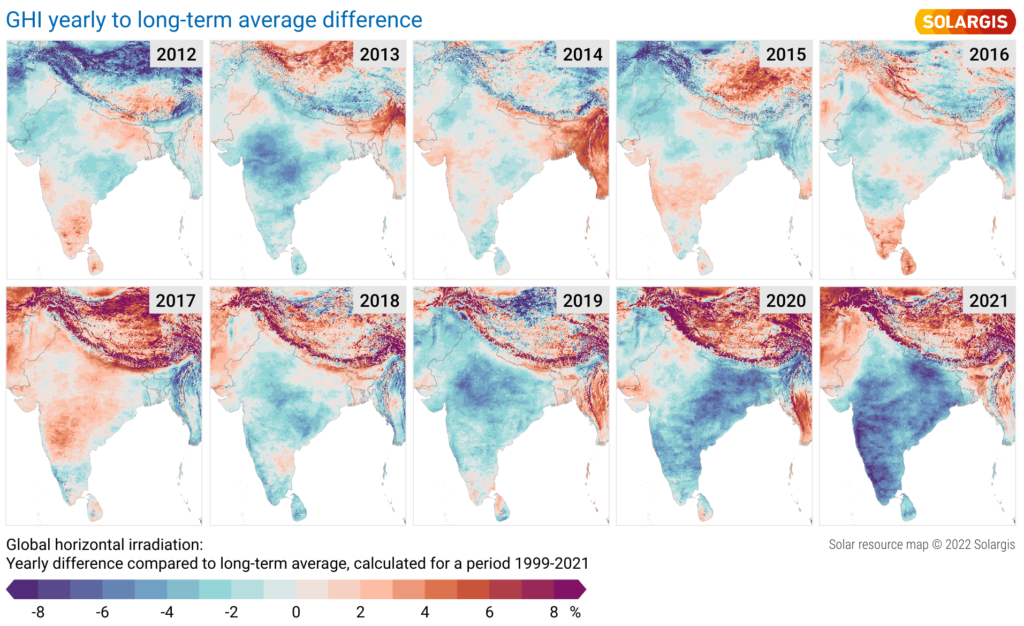
In India, Solargis’ 10-year Solar Performance Maps reveal how irradiance levels are up to seven percent below average for the sub-continent over the last four years, particularly commonplace around highly developed areas where aerosols and cloud cover can impact resource availability.
“If this data isn’t considered by developers, it could result in solar farms underperforming, with wider implications for investor confidence in one of the world’s fastest growing solar markets,” said Solargis.
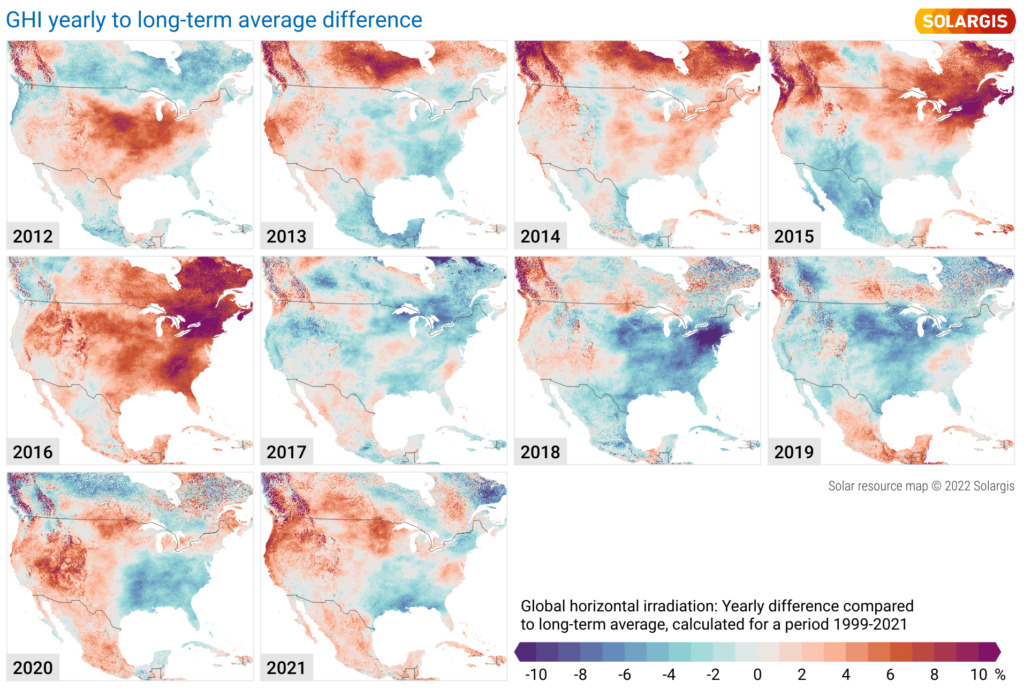
Meanwhile, in North America, there has been below-par irradiation in the North and Southeast when comparing the last 10 years of averages versus long term trends, Solargis’ maps show. Above average recordings in the northwest (see image) reflect anomalies such as the recent heat dome which saw temperatures reach record highs of 49.6 degrees Celsius, said Solargis.
Drawing on such data, developers and asset owners in North America can better prepare their projects for variable weather conditions, said Solargis, adding that this will be critical as the Investment Tax Credit (ITC) phases out, impacting long-term revenue security.
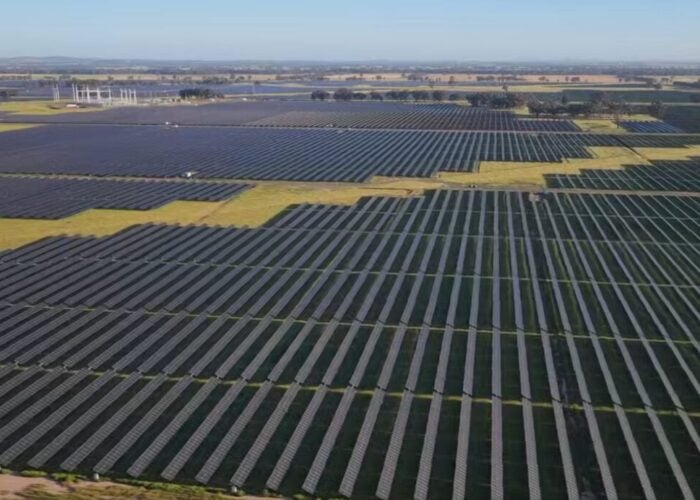
In Australia, the last five years of map data indicates significant irradiance variability across the continent when compared to long-term averages, reflective of extreme weather conditions that contributed to events such as the “Black Summer” bushfire season of 2019-2020.
“The future of solar integration on the continent depends on expert, reliable understanding of how investors and asset managers can prepare for and manage extreme weather events while integrating these future technologies into the grid as the nation transitions from fossil fuels,” said Solargis.
“Controlling the weather is outside of our capabilities, but what solar developers, owners and operators can control is their knowledge,” said Solargis CEO Marcel Suri.
“Vital, trusted intelligence on the solar resource, albedo, and specific geographical conditions at project sites can be the difference between an asset which retains its value throughout its lifecycle, and one which fails to live up to its potential.”