As solar plants age and face varying environmental conditions, the possibility of voltage collapse increases. Thomas Mart and Jeetu Jangle of Solarlytics examine the problem and how best to tackle it.
Voltage collapse is a critical issue in solar power systems, occurring when the solar array’s peak power voltage falls below the inverter’s operating range. This misalignment can lead to significant energy production losses, especially as solar plants age and face varying environmental conditions. Understanding the causes and impacts of voltage collapse is essential for maintaining the efficiency and longevity of solar installations.
Try Premium for just $1
- Full premium access for the first month at only $1
- Converts to an annual rate after 30 days unless cancelled
- Cancel anytime during the trial period
Premium Benefits
- Expert industry analysis and interviews
- Digital access to PV Tech Power journal
- Exclusive event discounts
Or get the full Premium subscription right away
Or continue reading this article for free
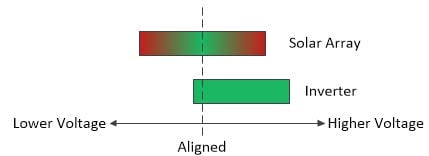
When a solar plant is new, the solar array and inverter are perfectly aligned, allowing maximum energy transfer. However, as the system ages and environmental conditions fluctuate, the solar array’s peak power voltage can drop below the inverter’s operating range, leading to voltage collapse and substantial energy production losses.
Voltage collapse represents a significant challenge in solar plant operations, particularly as systems age and face varying environmental conditions. Addressing this issue is crucial for optimising energy production and ensuring the long-term viability of solar installations.
The following are key voltage thresholds:
- Standard 600V systems: MPPT range 300-525V DC
- Standard 1000V systems: MPPT range 600-850V DC
- Standard 1500V systems: MPPT range 900-1250V DC
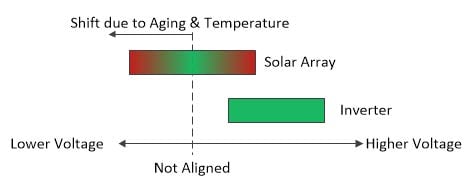
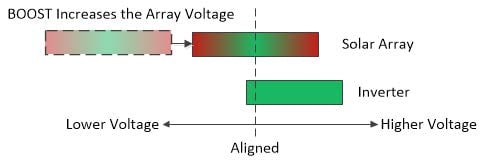
In contrast, alignment is a problem as the solar array ages and especially during warm weather. As shown in Figure 2, the solar array voltage drops and shifts to the left.
The solar array peak power voltage and the inverter’s MPPT range are no longer aligned, resulting in a loss of energy production.
Why does it occur and which regions are affected?
Coldest temperature determines string length
The DC field voltage is defined at the engineering stage. It needs to match the inverter MPP range and is temperature-dependent. The modules have a negative temperature coefficient: they produce higher voltage at lower temperatures. This coefficient depends on the module technology and may be in the range of 0.25-0.47%/K. The nominal MPP voltage Vmpp is given at standard test conditions STC (at a temperature of 25 degrees Celsius). This means that the coldest local temperature determines the string length because if the DC field voltage is higher than the inverter MPP voltage window, the inverter will not switch on and losing out on all that winter sun energy would be a pity on a clear blue sky sunny day. The coldest local temperature is derived from long-term statistics, e.g. the last 20 or even 50 years. Choosing the all-time lowest temperature may result in a short string length.
The maximum string length calculation is according to the following formula:
Maximum String Length = Maximum System Voltage/(Module Voc × (1 + (Tmin – 25°C) × Temp_Coeff_voc)
Where:
- Voc = Open circuit voltage at STC
- Tmin = Minimum expected temperature
- Temp_Coeff_voc = Temperature coefficient (%/K) at open circuit voltage
Example: Location with -10° Celsius lowest temperature and panel with -0,3%/K coefficient at open circuit voltage, maximum string length = 1,000V/(40V x (1 + (-10-25) x -0,3%) = 22.6 panels Æ22 panels.
Hottest temperature and degradation determine if voltage collapses
Based on the above-defined string length, the DC field voltage during hot summer days is also known. Due to the negative temperature coefficient, it is lower but still needs to be within the inverter MPP voltage window. This is generally safely achieved in new plants.
The minimum string voltage can then be calculated by:
Minimum string voltage = N × Vmpp × (1 + (Tmax – 25°C) × Temp_Coeff_vmpp)
Where:
- N = Number of modules in string
- Vmpp = Maximum power point voltage at STC
- Tmax = Maximum expected temperature
- Temp_Coeff_vmpp = Temperature coefficient (%/K) at maximum power point
Example: with 22 panels string length, max 50° Celsius ambient temperature, Vmpp of 33V and -0,4%/K coefficient at Vmpp, minimum string voltage = 22 panels × 33V × (1 + (50 – 25°C) × -0,4%) = 653V
This minimum string voltage is well within the inverter voltage window but may be further impacted by DC cable losses and panel degradation.
Locations with big temperature swings are challenging
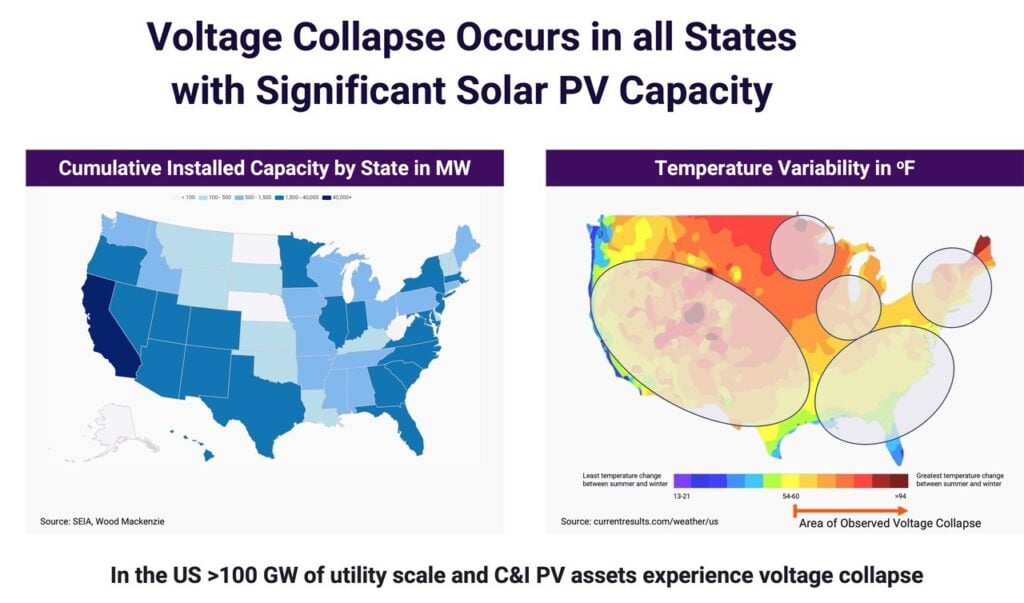
What is the hottest temperature at this specific project location? In some (e.g. tropical) locations, the difference between the coldest and warmest temperatures may only be a few degrees Celsius. In other places the temperature swing is vast, more than 50 or 60 degrees Celsius. Such locations are much more prone to voltage collapse.
Some of the high-risk locations are:
- Desert regions
- Annual temperature range: -5°C to 50°C
- Module surface temperatures up to 85°C
- Continental climate zones
- Annual temperature variation: 60-70°C
- Winter minimums: -30°C to -40°C
- Summer maximums: 35-40°C
- High Altitude Locations:
- Lower air density cooling effects
- Extreme temperature swings
Voltage decreases with age
Due to age degradation, the situation is further aggravated. If the panels lose 0.5 or 1% voltage on a yearly basis it becomes predictable when and how much the summer DC field voltage collapses, i.e. falls under the inverter MPP window.
Tracker space may also dictate string length
Every tracker has a certain wind and panel load it can handle. At the engineering stage, practical considerations for the construction and O&M are also kept in mind: the plant layout should be as regular as possible and ideally avoid strings jumping from one row to another. This may mean including one or two fewer modules per string than calculated by the lowest temperature calculation. But reducing string size for such reasons will reduce the string voltage which may eventually result in voltage sagging issues. The shorter the string the higher the risk for voltage collapse. If you reduce string length for mechanical/mounting/ cabling reasons, this will reduce the string voltage which may be problematic at high temperatures.
Inverter MPP voltage window may be customised
For reasons of nominal power increase or reduction of harmonics in some plants the inverter parameters for the MPP voltage window are customised so that the actual cut-off value of the lower MPP voltage is higher than in the standard data sheet. This of course will be documented in the as-built documentation. In such cases, the voltage collapse may occur earlier or more frequently.
Grid voltage temporarily at or above upper limit
The medium voltage grid voltage code entails a 5% tolerance on both sides, e.g. a 40kV connection can operate between 38 and 42kV.
If the connected distribution grid has a steady bias to either high or low voltage, this can be compensated with mechanical tap changer settings at the transformers. If the grid voltage swings to both sides tap changers do not help. The requirement to evacuate at the upper limit is fully transferred to the inverter MPP window: it shifts the inverter’s operating range by the same percentage, creating even greater misalignment; an inverter MPP window from 600-850V is shifted to 630V-892V.
Voltage degradation components
A number of other factors in a PV power plant can contribute to lower voltage and consequent voltage sagging. These include:
- Initial Light-Induced Degradation (LID)
- Crystalline silicon: 1-3% rst 24-48 hours
- PERC modules: Additional 0.5-1% LeTID effect
- Stabilisation period: 2-4 weeks
- Annual Degradation Factors which may occur
- Thermal cycling: 0.3-0.5%/year
- UV exposure: 0.1-0.2%/year
- Moisture ingress: 0.2-0.3%/year
- Connection degradation: 0.1-0.2%/year
Predictive modelling
This formula calculates the voltage loss over a given time. We can see that the light-induced degradation takes away once from the initial voltage, then the annual degradation obviously scales with the years.
Voltage(t) = V0 × (1 – LID) × (1 – r)t
Where:
- V0 = Initial voltage
- LID = Light-induced degradation (%)
- r = Annual degradation rate
- t = Time in years
Example: Voltage (10 year) = 45V x (1-2%) x (1 – 0,5%) 10 = 44.1V x 0.95= 41.9V
How much money is lost?
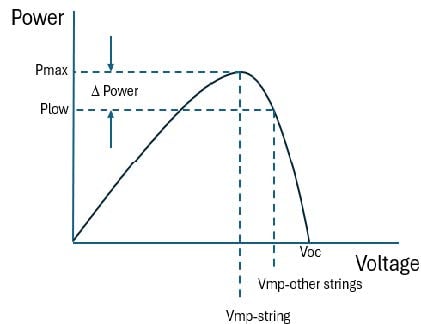
During voltage collapse, the inverter cannot match the field voltage and is hindered to extract the full PV field power. As shown in the graph in Figure 4, the system operates on the right side, i.e., the steep gradient, and incurs double-digit losses during these hours.
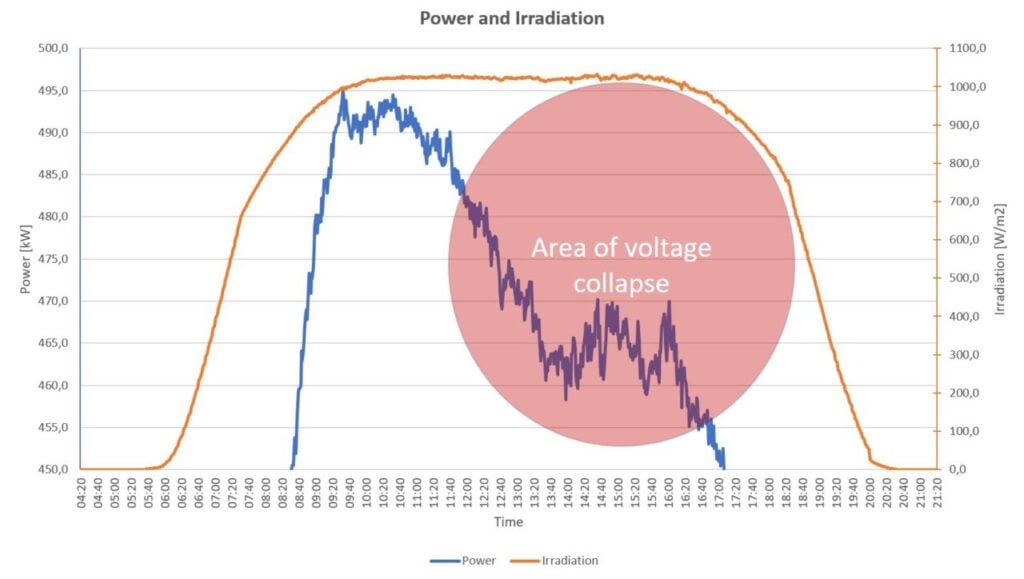
Based on the frequency of occurrence and the degree of impact the financial loss can be calculated, valuing the lost MWh into lost revenue by multiplying it with the applicable time of day tariffs. Unfortunately, the voltage collapse occurs in the time period of highest tariff, as illustrated in Figure 5, which is based on a project in California.
Loss calculation
It is important to understand the long-term financial losses of voltage collapse, which can be calculated by multiplying the hourly loss with the yearly hours of occurrence and the applicable tariff, the plant size and the remaining plant life.
a) Direct production loss
Annual Loss = P × h × r × t × e
Where:
- P = Plant capacity (MW)
- h = Hours of collapse per year
- r = Average production reduction
- t = Tari rate ($/MWh)
- e = Grid export efficiency
Example: 15% voltage collapse loss during 400 hours/year in a 100MW/130MWp plant with a US$160/ MWh in summer peak, 1,900 MWh/MWp specific yield and eight years left in the PPA
Total loss = 15% x 100MW x US$160/ MWh x 400 hours/year x 8 years = US$7.7 million
Further degradation and/or hotter summers would worsen the loss.
b) Secondary financial impacts
Secondary impacts for the plant may include increased operation and maintenance costs, higher insurance premiums or reduced component lifespans.
How can it be mitigated?
To minimise the impact of voltage collapse in a PV power plant, the mismatch between the DC field voltage and the inverter MPP window needs to be healed. Exchanging the inverters and/or transformers is not an economic option, and inverters with lower MPP windows are not readily commercially available.
Increasing the DC field voltage could be achieved with longer strings, but a full re-stringing of the plant is complex and requires substantial downtime. The plant design would also be complex, with strings jumping from row to row. Generally, it would not be considered a valid option.
Inserting newer modules with higher voltage into the existing strings is challenging for legal reasons (PPA terms, module warranties). The form factor of newer modules is different, so re-shuffling all modules is out of the question as impossible or at least cost-prohibitive.
Replacing all existing modules with new modules may be considered a valid option in cases where the existing modules have issues. However, if the old modules are still in fine working condition this represents a major investment and a full repowering project with an execution time of six to 18 months, depending on project size.
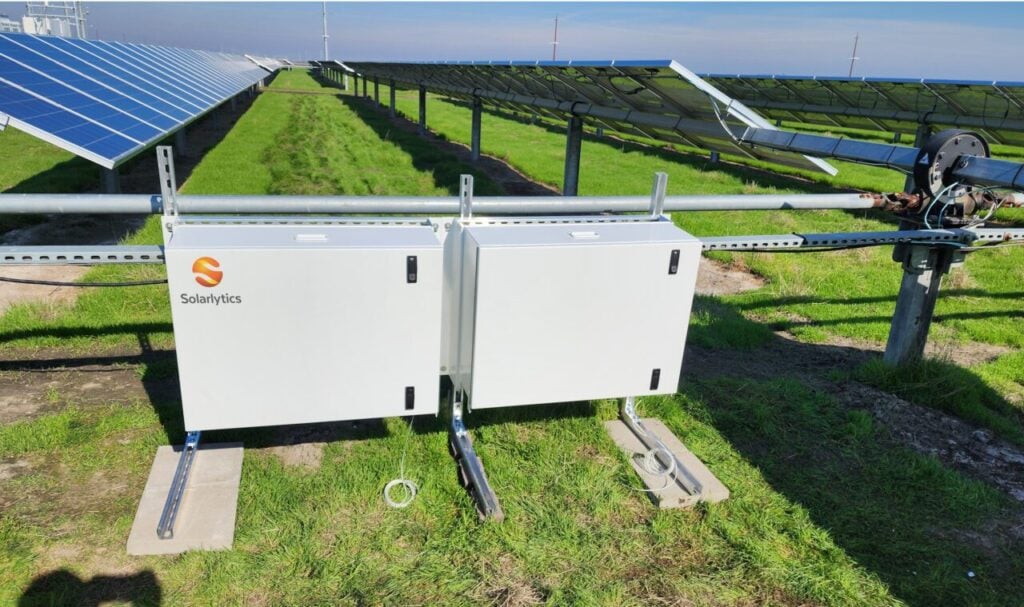
The most pragmatic solution is the installation of DC-DC converters. They are mounted next to the combiner box and can adjust the DC field voltage to the needed level. This increases energy production by aligning the solar array voltage with the operating range of the inverter (see Figure 6).
In the PV field, this looks like the example at the start of this article. The DC-DC optimisers are placed either onto the existing racking if place and load bearing allow, or on their own mounting structure. Each of the shown units features four channels which typically equates to eight strings.
DC-DC converter implementation
The DC-DC converter has the following specifications which are suitable for 600V and 1,000V systems:
- Technical specifications
- MPPT tracking range: 250-900V DC
- Output voltage range: 600-950V DC
- Conversion e ciency: 99+%
- Power rating: 40kW per unit
- Response time: <100ms
- Monitoring integration: string/2-string -level data
- Thermal management system
- Nema 3R/IP14
- Smart monitoring system, data collection parameters
- String-level voltage: 30-second
intervals - Current measurements: 30-second
intervals - Temperature sensors: back of
module temperature and inside unit
temperature
- String-level voltage: 30-second
- Analytics SaaS Platform
- Real-time performance monitoring
- Automatic alert generation
- Performance reporting
- API for data retrieval to monitoring
platforms
This approach comes with several secondary benefits. The required downtime for the installation is marginal. The MPP tracking is shifted from the central level to the string or 2-string level which resolves any string mismatch. Furthermore, the connected strings are monitored and reported in a high time resolution.
Healing process for voltage collapse
The underperforming project assessment begins with an initial desktop evaluation, which includes analysing historical operations and performance data including drone reports as available, reviewing temperature profiles, calculating degradation rates and assessing the financial impact. Here it is determined if the root cause of the under-performance is in fact voltage collapse.
If this is the case, the solution may be a DC-DC converter at the string level, which increases the design phase and involves specifying the required equipment, planning the installation process, conducting performance modelling and calculating the expected return on investment (ROI).
Once the design is finalised, the installation process begins with the preparation phase, which consists of a site survey, verification of as-built documentation, equipment staging and setting up communication systems. The implementation phase follows, covering the installation sequence, testing procedures, commissioning protocols and performance verification to ensure optimal functionality.
Conclusion
Mitigating voltage collapse in solar power systems requires a comprehensive approach that addresses both the technical and environmental factors contributing to this issue. Solutions such as using DC-DC converters to adjust the DC field voltage, implementing robust monitoring systems and employing predictive modelling are essential for maintaining optimal performance and minimising financial losses. By understanding the causes, impacts and mitigation strategies for voltage collapse, solar plant operators can ensure the long-term efficiency and viability of their installations. As the solar industry continues to evolve, addressing voltage collapse will be crucial for maximising the potential of renewable energy sources and sustaining the growth of solar power.
Authors
Thomas Mart, co-founder of Solarlytics, is a technical executive with 25 years of international project business responsible for projects values of hundreds of millions of euros. Since 2009 he has become an expert on utility-scale photovoltaics in the US and Europe. After posts in Spain, Australia and South Africa he is now based in Germany and heads up the European operations for Solarlytics.
Jeetendra (Jeetu) Jangle is vice president of engineering at Solarlytics. A distinguished technology leader with over 25 years of experience in steering innovation and achieving success across both startups and large enterprises, his extensive background includes leading engineering teams in diverse sectors such as IoT, hardware, SaaS, and telecom. He co-founded Wellcore, a health and wellness startup, and he has been instrumental in key roles at Blackberry, Xoriant, and Veraz Networks, where he contributed to the company’s IPO.


")


