
Digitalisation offers PV plant operators the opportunity to shift from preventive to predictive maintenance practices. Eduardo Sarquis reports on research aimed at shedding further light on the system performance benefits of moving to a predictive O&M strategy.
In 2012, the total capacity for electricity generation through solar photovoltaic (PV) technology was 100GW. One decade later, in April 2022, the world reached a landmark of 1TW. Half of this installed capacity was installed in the last three years from 2018 [1]. The global market for solar power is growing exponentially. SolarPower Europe, an association that represents over 270 organisations across the entire solar sector, predicts in its “Global Market Outlook For Solar Power 2022-2026” that global solar capacity will more than double to 2.3TW by 2025. [2]
Try Premium for just $1
- Full premium access for the first month at only $1
- Converts to an annual rate after 30 days unless cancelled
- Cancel anytime during the trial period
Premium Benefits
- Expert industry analysis and interviews
- Digital access to PV Tech Power journal
- Exclusive event discounts
Or get the full Premium subscription right away
Or continue reading this article for free
The Covid-19 pandemic has caused significant delays in many installations of renewable energy projects due to disruption of global value chains caused by lockdowns and geopolitical frictions. Nevertheless, these problems have not undermined the “green infrastructure boom”. Solar energy capacity additions continue to break records with 145GW in new installations becoming operational globally in 2021 and 190GW in 2022 [3].
The initial challenge of making solar technology affordable and accessible seems to have been overcome. Due to advances in the industry in making systems more effective, durable and affordable, the investment needed to install a system is only a fraction of what it once was.
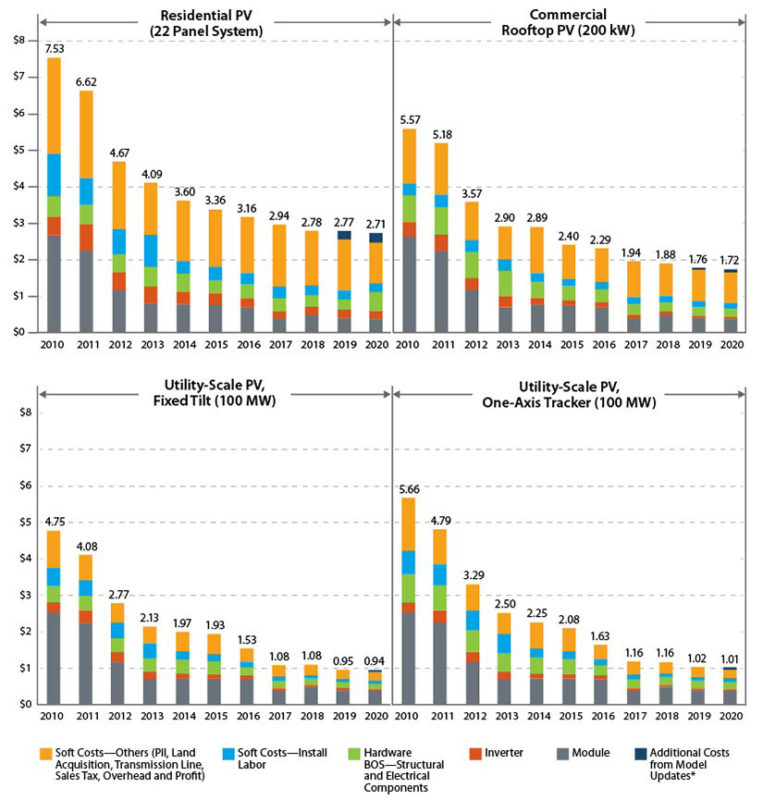
An analysis conducted by the National Renewable Energy Laboratory (NREL) shows that between 2010 and 2022 there was a reduction of around 66% of the total costs associated with the installation of PV systems for residential or commercial rooftops. For utility-scale ground-mount systems the reduction was even larger, around 81% [4].
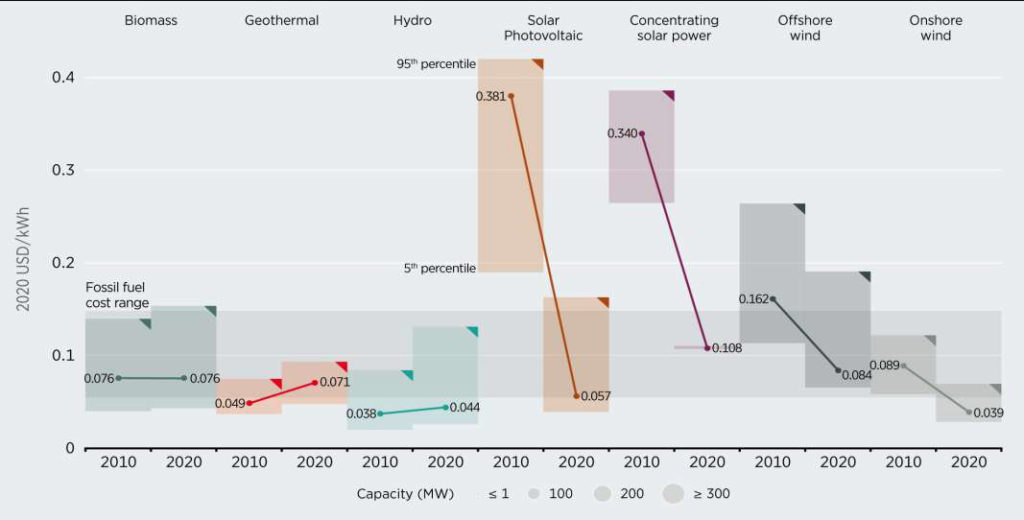
As a consequence of this, the levelised electricity cost (LCOE) generated by PV technology is now the third cheapest among renewables, only behind hydro and onshore wind [5]. Most renewable power generation technologies have had a lower global LCOE than fossil fuel technologies since 2020 (Figure 2).
The continuous and successful increase in the installation of solar systems creates new challenges, one of which is the operation and maintenance (O&M) of larger and larger fleets of systems. Contrary to what was once a popular belief, PV power plants are not maintenance free; they require a regimen of continuous monitoring, periodic inspection, scheduled preventive maintenance, and service calls [6]. Lack of attention to O&M results in costs higher than those presented in initial investment plans, increasing project risks; a situation that can undermine market confidence [7]. This is especially critical if we observe that most PV plants have only been operational for a short period of time. Around 90% of PV plants worldwide have become commercially operable in the last seven years, a relatively short period compared to their expected lifetime of 20+ years [8].
These systems are still experiencing the moment of youth in their life. With the ageing and flourishing of new technologies, an increasing need has been observed for removal and replacement of parts or the entire system [9]. This means that the demand for professional and experienced O&M services in the PV industry tends to increase dramatically. Given evolving technologies, climate and maintenance resources, and all other influencing factors, optimising the O&M of photovoltaic systems is critical to protecting investments in solar energy infrastructure.
O&M of PV systems
The O&M of PV systems includes carrying out various activities. Among them, monitoring and maintenance are activities of special importance. In the photovoltaic industry, maintenance practices have been built around the recommendations of component manufacturers – such as modules and inverters – and national and international technical standards [10].
Best-practice guidelines in the industry recommend the use of preventive maintenance through annual inspection plans. It focuses on preventing major future problems from occurring through a regular routine of visual and physical inspections, as well as verification activities. Preventive maintenance improves system performance, prevents the occurrence of more severe failures, and maximises the life of the system.
Preventive maintenance inspections are performed by trained personnel following checklists to ensure that inspections are thorough and complete [11]. According to industry best practices, all inspection activities and checklists, as well as the inspection time schedule, should be established in a detailed annual maintenance plan [12]. It should also contain the guidance on how to test and maintain key components given by their manufacturers [10]. Activities must be consistent with warranty terms and national standards for periodic inspection of certain electrical components.
A close look into an example of annual maintenance plans for utility and distributed solar plants, suggested by recent best practice guidelines for PV O&M [12], reveals an extensive list of inspection activities, some of which are indicated as mandatory (minimum requirement) while others are only recommendations. The frequency at which these tasks must be carried out varies, but the vast majority are annual.
Whenever possible, the verification should be extended to the entire system. In the case of very numerous components, such as the clamps that secure the modules to the mounting structure, the check can be performed on only a random subset of components.
In addition to basic visual inspection, specialised inspections, such as infrared (IR) thermography, electroluminescence (EL) imaging, and I-V curve tracing, can be used to assess the quality and performance of equipment on site [12]. These verifications include specialised tools such as an I-V curve tracer and an infrared thermographic camera. These inspections might incur larger costs, and their adoption must consider the potential benefits according to the system size, design, complexity, and environment. As pointed out by [10], preventive maintenance must maximise the output of the system, prevent more expensive failures from occurring, and maximise the lifetime of a PV system. Thus, the cost of scheduled maintenance must be balanced with the yield and cash flow throughout the life of the system.
Associated with the preventive strategy, best-practice guidelines in the industry also recommend the adoption of corrective maintenance. Corrective maintenance paradigms represent a strategy based primarily on reacting to equipment failures and system breakdowns. This paradigm, which was once the standard in some industries, allows low upfront costs, but also brings with it a higher risk of component failure and higher costs in the long run [13]. In the PV industry, the core strategy is based on preventive maintenance, and corrective maintenance is reduced to unplanned interventions to restore the systems’ normal operation after a failure has been identified [12].
Faults or conditions that introduce a safety problem or revenue losses due to reduced system output are the main motivations for an unplanned intervention.
Safety problems should be addressed as soon as possible. Lost revenue should take into account the response cost according to the size of the system, geographic location, spare parts inventory, other scheduled maintenance and fleet performance requirements [10]. For example, for small residential systems, a fleet operator may make repairs only when losses are high enough to justify a truck roll to the area or at the next regularly scheduled inspection of a site. Generally, the maximum response time for alerts or corrective action is specified as part of the O&M service contract but typically will be 10 days or less for non-safety-related corrective maintenance services [10, 12]. The combination of the preventive and corrective maintenance paradigms has been used successfully in the PV industry for the past decades.
Digitalisation and new trends
In the continuing technological evolution of PV systems, there is a trend towards expanding the collection and digitalisation of production data, which allows for more complex and comprehensive monitoring. This sets the stage for a more data-driven approach, so that in recent years best practice guidelines have included predictive maintenance among the paradigms adopted in the O&M of photovoltaic systems [12].
Predictive maintenance, also known as condition-based maintenance, is a data-driven strategy that analyses the PV system’s monitoring signals to identify signs of degradation and detect anomalies, identify faults (diagnostics) and estimate the equipment’s remaining useful life (prognostics). The extracted information is used to prioritise maintenance activities and resources.
The information collected should allow assessing the need for intervention, instead of adopting a pre-established calendar of interventions. In the conventional preventive strategy, systems without problems are inspected only as a routine, and systems can remain with unnoticed failures for a long time until the next inspection occurs. Alternatively, adopting a predictive strategy should allow reducing the frequency of interventions when possible or anticipate them if necessary.
Information that allows identifying problems at an early stage, before a critical failure occurs, can also extend the time available to plan interventions and reduce the need for urgent corrective actions, which often translates into more expensive and logistically difficult interventions.
The success of the predictive approach depends on the quality of the data interpretation. To decide to postpone or anticipate an inspection or maintenance intervention, high diagnostic reliability is required. Achieving such a high level of confidence normally involves some manual data analysis before the decision-making, which may impose limitations on the scalability of monitoring capability.
Companies specialised in O&M have monitoring centres with a specialised team that evaluates the performance of systems to identify problems with the help of monitoring software equipped with automatic alert features [14]. It is key that the automatic monitoring system triggers as few false alerts as possible and ensures no critical problem passes unnoticed. Reliable solutions capable of helping the monitoring process are highly needed for the scalability of the O&M monitoring services.
In the scientific literature, there are several studies and procedures for automatic fault detection in PV systems, however there is a general lack of validation of such methods under real operating conditions. Recently, in a study with field data from a portfolio of 80 photovoltaic systems for multiple years [15], we have verified that a combination of multiple fault detection algorithms can achieved a sensitivity of 99% and a specificity of 93%, and less than 12% false alerts. This means that an alert will be raised for 99% of the days with a fault and 7% of the days without any fault.
Knowing the level of reliability that can be expected from data interpretation, in this case from the automatic fault detection system, is fundamental to understanding how much we can trust its results and whether additional measures are needed to balance its limitations, such as, for example, manual verifications before scheduling an intervention.
Comparing O&M strategies
The adoption of predictive maintenance fundamentally changes the O&M strategy. It holds clear potential for improvement and comes with strong expectations. For the technological advancement of O&M practices, it is important to balance the expectations and objectively quantify the potential gains from investing in improved monitoring and maintenance practices.
To evaluate the potential benefits of adopting a maintenance strategy based mainly on predictive actions, we first need to establish a methodology to quantify the effects that a maintenance strategy can have on a portfolio of systems.
An O&M strategy is the collection of resources, procedures and rules used to identify defects and repair or replace components so that the system can perform its designated function during its expected useful life [16]. Understanding the consequences of adopting different maintenance strategies is not a simple task. Various aspects should be considered, such as the frequency with which faults occur, their impact on system performance, the procedures adopted to detect failures, the sensitivity of the tools used for monitoring and inspection, and the reaction time for maintenance.
The designated function of a PV system is to generate electrical power, and the occurrence of faults will cause a reduction in system performance until the fault is detected and removed. The total energy yield loss will be a consequence of the severity of the fault and the time elapsed between its occurrence and repair. Different O&M strategies may lead to a shorter or longer time to detect and repair, resulting in a lower or higher total energy yield loss. Quantifying this yield loss is fundamentally important for comparing strategies. To do this, we adopted a methodology with four main steps:
- Define the fault-free expected yield for the PV system typical profile;
- Generate a random sequence of fault events;
- Define the sequence of O&M events in response to the faults;
- Quantify the impacts of the events on the energy yield.
In addition to evaluating the performance of the systems, it is important to measure the maintenance efforts made over the years, here characterised by the number of interventions and the number of repaired components.
PV systems are designed to match local conditions, but despite their individual characteristics, they are built with very similar architecture and components due to constraints imposed by other factors such as standards, regulations, procurement optimisation, etc. It is reasonable to assume that a group of systems with such similar characteristics can be fairly represented by a typical system whose specifications are an average design. In this study, we considered a 150kWp rooftop PV system with 576 PV modules connected to six string inverters.
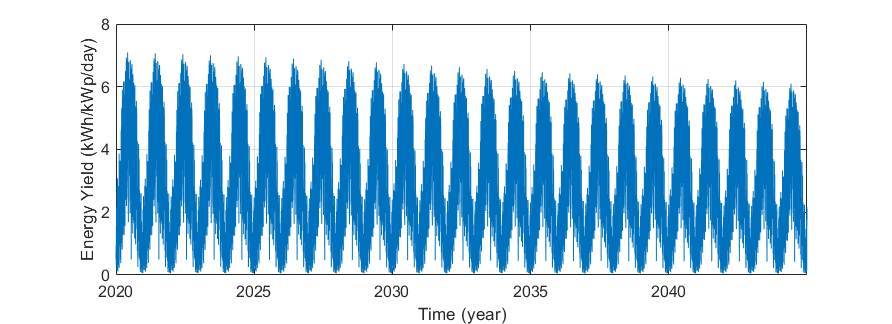
The expected energy yield for the typical system can be obtained using a project design tool for PV systems, e.g., PVSyst. The fault events will be added later; thus the simulation of expected energy yield must consider no losses due to soiling or shading and 100% availability. The performance loss rate was assumed to be 0.4%/year. The simulation provided a time series of energy yield in kWh/kWp per day for 25 years, and the weather conditions reflect the typical meteorological year (TMY) of Freiburg, Germany, as shown in Figure 3.
A component fault is an unexpected event that results in loss of performance. To generate examples of failure events, we rely on reliability engineering theory for modelling failure occurrence using the failure rate (λ). The failure rate is the probability of failure per unit of time, given that the component has not yet failed. For most of their operating life, electrical components have a constant failure rate. A constant failure rate leads the time-to-failure to be an exponential distribution [17] with λ as the rate parameter.
To generate examples of fault events, for each component and fault type, we define continuous random variables that follow an exponential distribution with λ equal to its failure rate. These random variables generate random samples, representing the specific time each component will be affected by each failure type. With a careful selection of quantitative data available in the literature [18], we have a list of the typical failure types for each type of component and their respective failure rates derived from field data of hundreds of PV systems.
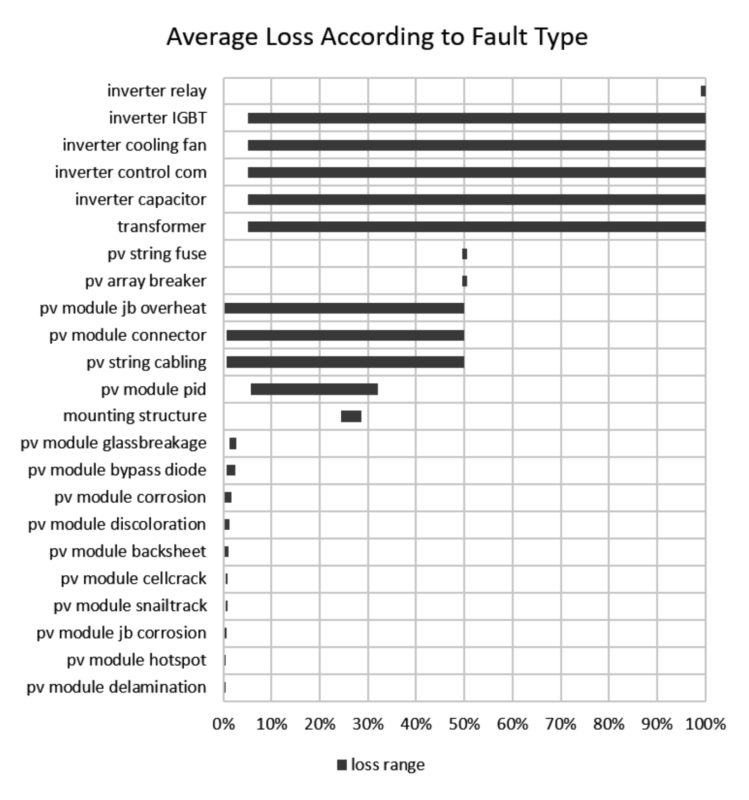
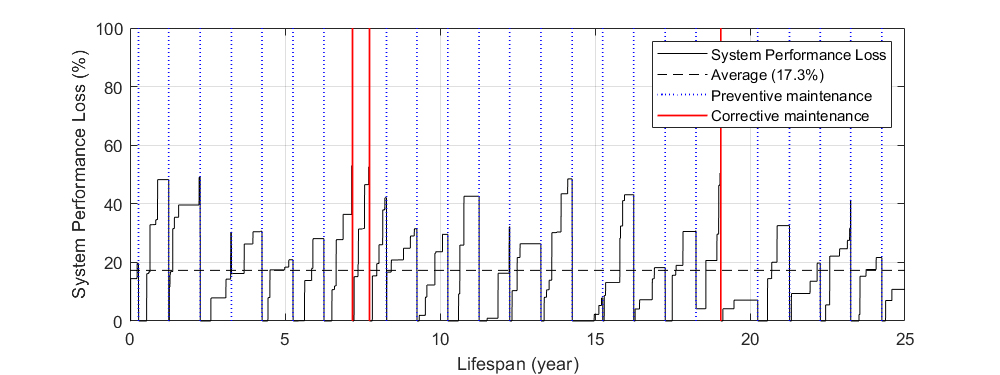
Each failure event causes the total or partial loss of performance of the affected component, which in turn results in reduced performance of the system as a whole. Figure 4 shows the range of power loss associated with each failure type for the typical system previously defined. The severity of each fault event is randomly defined to be somewhere between the worst and the best case. The system performance loss over the years is then a consequence of the accumulated losses due to the fault events.
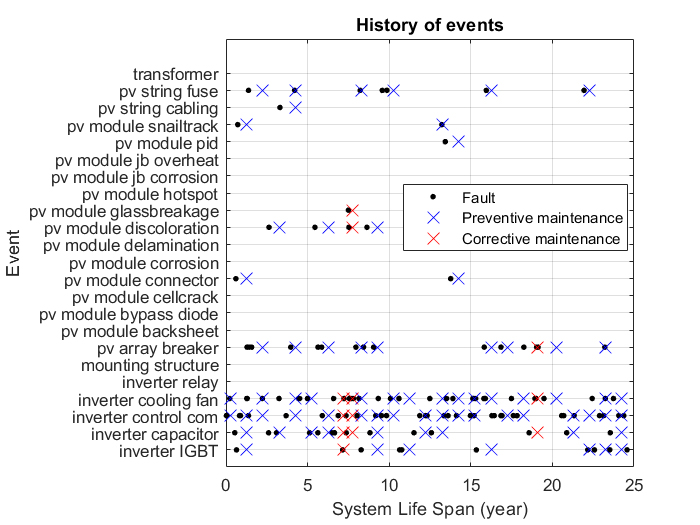
The inspection and maintenance events are defined according to the maintenance strategy. In the case of traditional maintenance practices based on preventive and corrective maintenance combined, the intervention events follow a pre-established calendar of inspections (one per year). If the system experiences a severe performance loss (e.g., > 50%), an exceptional urgent intervention is scheduled shortly after (e.g. 10 days).
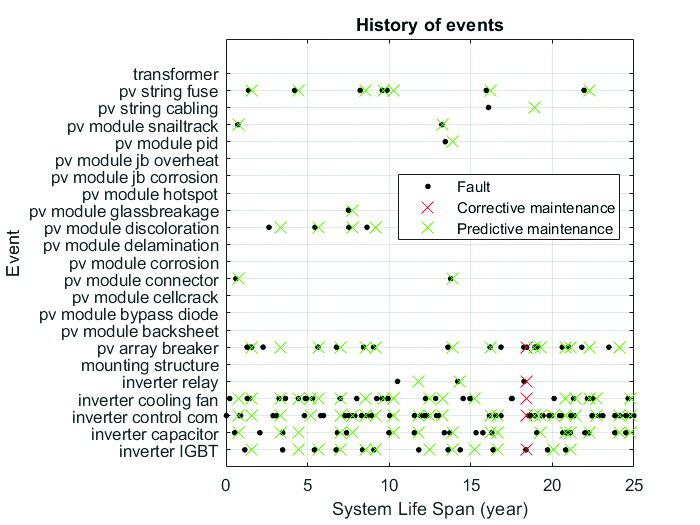
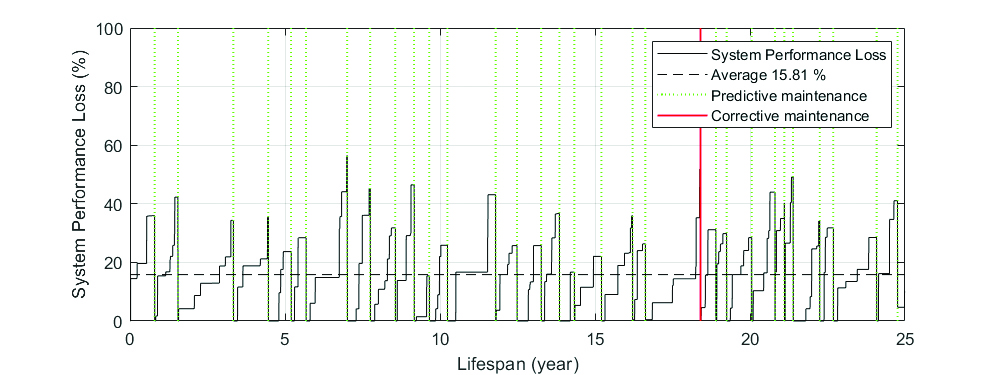
In case of a predictive maintenance strategy, the need for maintenance intervention is defined based on the identification of system performance loss above a tolerance (e.g., 20%), and the maintenance date is scheduled after a predefined time window (e.g., 90 days).
To simulate the limitations of data interpretation, a daily assessment of the system’s performance loss was considered with a sensitivity of 99% and specificity of 93%. This means that alerts are issued for 99% of days with a loss above tolerance, but also for 7% of days with acceptable losses. This limitation in accuracy needs to be counterbalanced by waiting for at least five alerts in 10 consecutive days before scheduling an intervention.
In an intervention, defective components are usually maintained by replacing them with new components of the same type. Here we assume the maintenance action is perfect, i.e., the performance loss associated with the defective component is fully recovered. A full recovery of the system performance loss will be observed after the day of maintenance.
The resulting energy yield considering failure and maintenance events is a direct product of the initial expected and the performance loss at each day throughout the 25 years lifespan. The average energy yield provides a measure of the effectiveness of a maintenance strategy for that particular story of failure events. By performing this calculation across a significant number of random stories (e.g., 1,000), we derive a representative measure of the effectiveness of the evaluated maintenance strategy for the scenario.
We applied the proposed methodology to test two maintenance strategies. The first adhered to best practices, involving preventive maintenance with a regular calendar of inspections. The second strategy focused on predictive maintenance, incorporating a dynamic inspection schedule with varying response times, ranging from one to 12 months.
For both strategies, we considered corrective actions in case of severe performance loss. In each scenario, we generated 1,000 stories of faults and maintenance events, and their metrics were averaged for comparison.
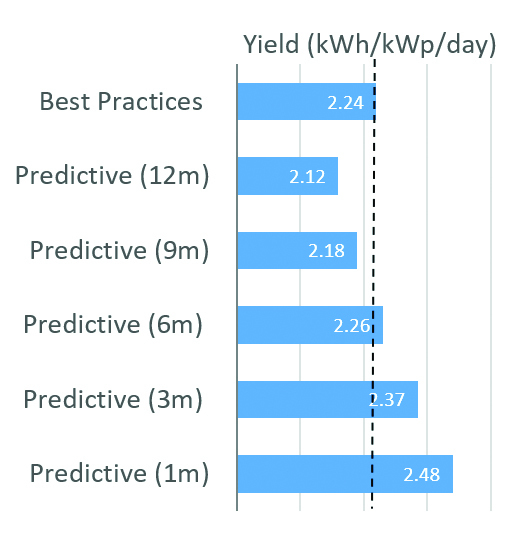
The resulting average energy yields summarised in Figure 9 reveal that, in comparison with best practices, the adoption of predictive strategy with large response time (nine and 12 months) reduce yield, while short response times (one and three months) improve yield up to 10%. There is a response time (in this case six months) in which energy yield is equivalent in both strategies.
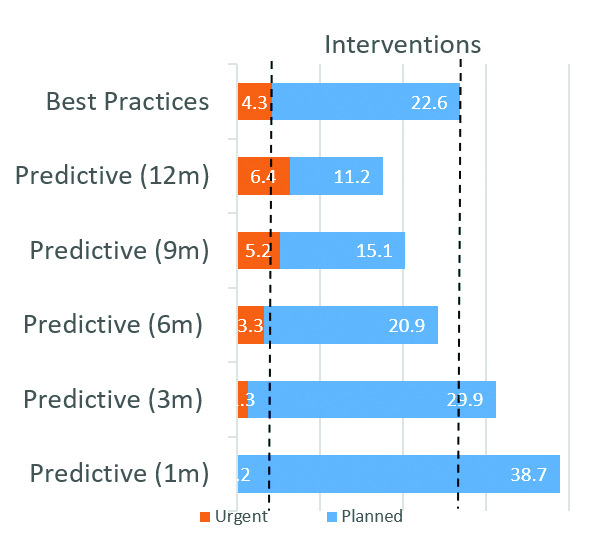
Upon examining the average number of interventions conducted, we see that, to sustain the same average energy yield level, the number of interventions with a predictive strategy was 10% lower compared to a preventive strategy. Shorter response times, especially within the three-month range, led to an overall increase in the total number of interventions. Notably, extremely short response times resulted in a significant increase in intervention frequency. Shifting our focus to unplanned urgent interventions, it is noteworthy that adopting a predictive strategy with a response time limited at six months reduced the need for urgent interventions.
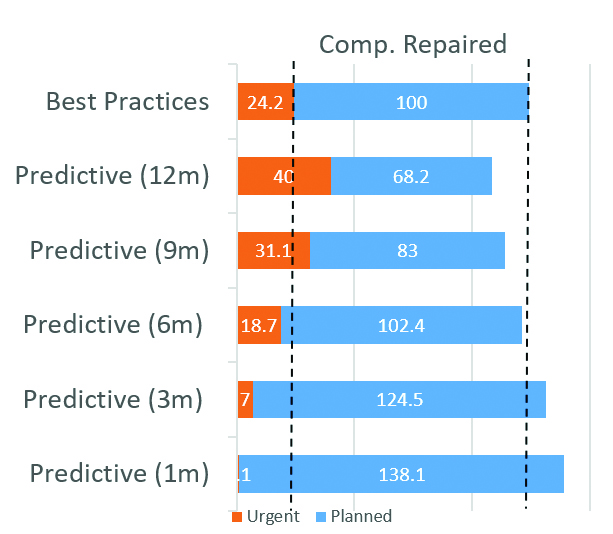
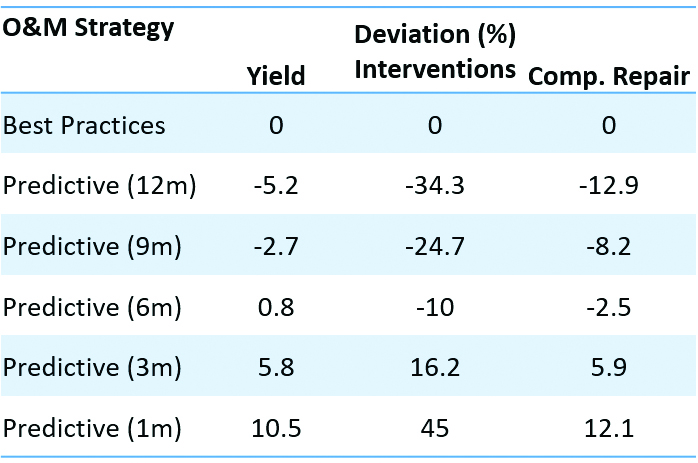
Putting together the deviations of yield, interventions and components replaced, we can see a sweet spot of between three- and six-months response time. In that range, the adoption of a predictive strategy provided additional yield with a small variation of the maintenance efforts, which is an improvement in comparison with best practices based on preventive actions (Figure 12).
Summary
Results show the benefits of moving towards a maintenance strategy mainly based on predictive actions. Namely, the need for urgent interventions is reduced, and the total number of interventions and replaced components can be reduced without compromising the average performance of the systems.
These benefits are very dependent on the response time, which is the time between the detection of a failure and the execution of an intervention for maintenance. Short response times can enhance the average performance of the systems, leading to higher energy yield, with an increase in the average number of interventions.
What exactly can we expect from a more data-driven strategy? A data-driven strategy gives you the power to decide between low effort and higher performance by tuning your loss tolerance and response times.
Is it really an improvement in comparison to the current industry best practices? It reduces the need for urgent, unplanned interventions. With the proper tuning, it is possible to increase the average energy yield or decrease maintenance efforts.
References
1] Renewables IEA. Analysis and Forecast to 2026. International Energy Agency: Paris, France. 2021.
[2] Europe S. Global market outlook for solar power 2022– 2026. Solar Power Europe: Brussels, Belgium. 2022 May.
[3] https://www.irena.org/Data/View-data-by-topic/Costs/Global-Trends
[4] https://www.nrel.gov/solar/market-research-analysis/solar-installed-system-cost.html
[5] La Camera F. Renewable Power Generation Costs in 2020–IRENA. International Renewable Energy Agency: Masdar City, Abu Dhabi. 2020 Jun.
[6] Enbar N, Key T. Addressing Solar Photovoltaic Operations and Maintenance Challenges, a survey of current knowledge and practices. Electric Power Research Institute EPRI White Paper. 2010.
[7] Hill RR, Klise GT, Balfour JR. Precursor Report of Data Needs and Recommended Practices for PV Plant Availability Operations and Maintenance Reporting. Sandia National Lab.(SNL-NM), Albuquerque, NM (United States); 2015 Jan 1.
[8] Walker H, Lockhart E, Desai J, Ardani K, Klise G, Lavrova O, Tansy T, Deot J, Fox B, Pochiraju A. Model of operation-and-maintenance costs for photovoltaic systems. National Renewable Energy Lab.(NREL), Golden, CO (United States); 2020 Jun 1.
[9] https://pv-magazine-usa.com/2022/05/17/solar-om-whya-long-term-maintenance-plan-is-essential/
[10] Walker HA. Best practices for operation and maintenance of photovoltaic and energy storage systems. National Renewable Energy Lab.(NREL), Golden, CO (United States); 2018 Dec 21.
[11] Haney J, Burstein A. PV system operations and maintenance fundamentals. Solar America Board for Codes and Standards Report. 2013 Aug.
[12] B. Clarke, A. Ara and W. Hemetsberger. O&M Best Practice Guidelines. Version 5.0. SolarPower Europe. 2021.
[13] Enbar N, Weng D, Klise GT. Budgeting for Solar PV Plant Operations & Maintenance: Practices and Pricing. Sandia National Lab.(SNL-NM), Albuquerque, NM (United States); 2016 Jan 1.
[14] Rapaport S, Green M. IEA PVPS Task 13: The Use of Advanced Algorithms in PV Failure Monitoring. Tech. rep., International Energy Agency, IEA PVPS Task 13; 2021.
[15] Sarquis Filho EA, Kollosch B, Müller B, Holland N, Kiefer K, Costa Branco PJ, Reise C. Development and Evaluation of an Automatic Failure Detection System for O&M of PV Portfolios.
[16] Kelly A. Plant maintenance management set. Elsevier; 2006 Jun 7.
[17] Breneman JE, Sahay C, Lewis EE. Introduction to reliability engineering. John Wiley & Sons; 2022 Apr 26.
[18] Sarquis Filho EA, Zúñiga AA, Fernandes JF, Branco PJ. Failure Rates in Photovoltaic Systems: A Careful Selection of Quantitative Data Available in the Literature.
Author
Eduardo A. Sarquis Filho, Ph.D. in electrical and computer engineering, is head of data analytics and modeling at Enmova GmbH. His areas of expertise include data analytics applied for photovoltaic systems. In 2020-2021, he contributed to R&D projects with Fraunhofer ISE, focusing on cost-optimisation for O&M of PV power plants. Since 2021, Eduardo has been at Enmova, dedicated to devising advanced solutions for the efficient management of PV power plant portfolios.


