The US added a record 18.5GWac of utility-scale solar capacity in 2023 and has already added 14.3GWac in the first eight months of 2024, around 70% more than in the same period of 2023.
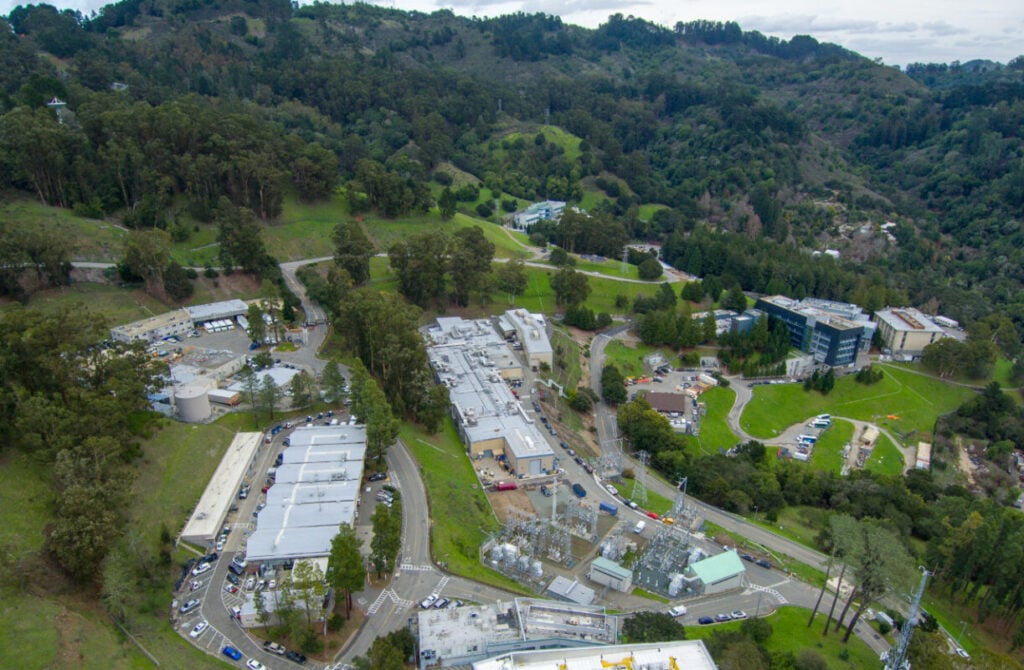
This would suggest that 2024 will be a record year for the US utility-scale solar sector, and this is a key takeaway from the latest report from the Lawrence Berkeley National Laboratory, a leading Californian research centre. ‘Utility-scale Solar, 2024 Edition’ breaks down the US utility-scale solar sector, alongside distributed industries, to provide a snapshot of the county’s solar profile.
Unlock unlimited access for 12 whole months of distinctive global analysis
Photovoltaics International is now included.
- Regular insight and analysis of the industry’s biggest developments
- In-depth interviews with the industry’s leading figures
- Unlimited digital access to the PV Tech Power journal catalogue
- Unlimited digital access to the Photovoltaics International journal catalogue
- Access to more than 1,000 technical papers
- Discounts on Solar Media’s portfolio of events, in-person and virtual
The report notes that the US’ total cumulative installed solar capacity has almost reached 200GWdc, and the authors expect the US to break this threshold in 2024. This will be a key step on the path to reaching 600GWdc of installed capacity by 2033, as forecast by the report, and shown in the graph below.
2023 was also a banner year for solar-plus storage deployments, with the US adding 52 projects, with a total capacity of 5.3GWac of PV and 3GW/10.5GWh, to its solar-plus-storage portfolio. The report notes that the majority of these new installations took place in the California Independent System Operator (CAISO) grid and the non-ISO West, demonstrating the growth of storage projects in the west of the country.
However, one area that has not seen significant year-on-year growth is the number of solar projects in ‘energy communities’. The 2022 Inflation Reduction Act (IRA) introduced a tax credit adder for projects located in such communities, such as areas historically reliant on coal production for employment, aiming to replace fossil fuel positions with those in solar.
The report notes that such tax credits have yet to take effect. In 2021 and 2022, respectively, the percentage of solar projects larger than 5MW built in energy communities accounted for 51% and 52% of all installations. This figure fell slightly to 49% in 2023 and 49% in the first half of 2024.
Regional variation
The report also notes that the US market “is becoming more geographically diverse”, with the Electric Relaibility Council of Texas (ERCOT) grid adding 4.2GWac of new capacity in 2023, the most in the country. Strikingly, CAISO only added the fourth-most new capacity—2.7GWac of new projects—behind both non-ISO grids in the south-east and the Pennsylvania-New Jersey-Maryland Interconnection (PJM).
Despite the relative growth in Texas, California remains the state with the highest penetration of solar power, expressed as a percentage of the state’s total in-state generation. The graph below shows how solar accounted for 27.7% of California’s in-state power generation in 2022, which increased to 28.2%, by far the most in the country.
This graph includes the top ten states by percentage of in-state electricity generation accounted for by solar, and it is an encouraging development that four of the US’ ten largest solar markets by installed capacity—California, Arizona, Nevada and Utah—are included in this graph, suggesting that solar power can form a cornerstone of large-scale energy generation.
California, Arizona, Nevada and Utah are the largest, sixth-largest, eighth-largest and tenth-largest markets by cumulative installed capacity, with 18.1GWac, 3.9GWac, 3.2GWac and 1.6GWac of capacity, respectively.
The role of the IRA
The IRA has had a profound impact on the US solar sector, helping to drive a near quadrupling of PV manufacturing capacity since its passage, and establishing a tax credit transferability market that is worth more than US$11 billion. The Berkeley Lab report also suggests that the continued positive tax benefits for solar developers enshrined by the IRA has helped minimise the levelised cost of electricity (LCOE) in the solar sector.
The graph below shows Berkeley Lab’s forecasts for LCOE with and without IRA tax credits in place, with the average cost of electricity ranging from US$30.52/MWh, with IRA tax credits, to US$46.48/MW, without such credits, a significant difference.
This is particularly significant considering that both average power purchase agreement (PPA) price and LCOE without tax credits increased between 2022 and 2023, reversing a years-long decline of prices, showing the importance of the IRA tax credits in keeping the cost of electricity down.
However, at this year’s RE+ event in California, project developers and domestic manufacturers were at odds over the purpose of the IRA; there is no doubt that it is responsible for significant financial change in the US solar sector, but there is uncertainty as to where the new financing should be invested.
Grids remain a challenge
Electricity infrastructure remains a key challenge for the US solar sector. The Berkeley Lab report notes that more than 1TW of utility-scale solar is currently waiting for grid connection, accounting for more than one-third of all power projects awaiting grid access.
Greater investment in grid infrastructure will be vital to commission many of the projects – which have received financial support and, in some cases, been built – and minimise curtailment rates. Curtailment rates have reached 3% in the CAISO grid in both 2022 and 2023, as shown in the graph below.
Meanwhile, curtailment rates in the ERCOT grid remain higher, reaching 7.3% in 2023, but this is a decline from the 9.4% reported in 2021 and the 10% reported in 2022, as shown in the graph below.
Our publisher Solar Media is hosting the 11th Solar & Storage Finance USA Summit, 22-23 October at 360 Madison Avenue in New York. Topics will include discussion around the shifting political and regulatory landscape, complex financing strategies and exploring emerging states for renewables. See the official site for more details.

